The Distribution Wizard in Weibull++
[Editor's Note: This article has been updated since its original publication to reflect a more recent version of the software interface.]
When performing life data analysis, Weibull++'s Distribution Wizard can provide guidance in selecting a distribution based on statistical tests. The Distribution Wizard uses three factors in order to rank distributions: the Kolmogorov-Smirnov (K-S) test, a normalized correlation coefficient and the likelihood value. This article will show how these rankings are calculated.
The Distribution Wizard
The Distribution Wizard in Weibull++ ranks the selected distributions in terms of the fit to the data entered, as shown in Figure 1.
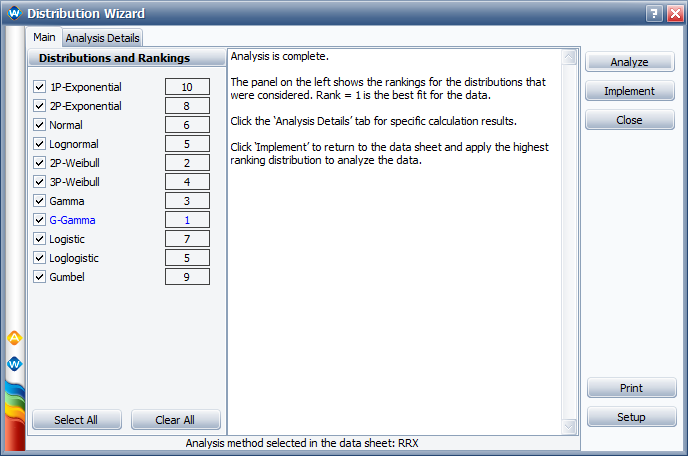
Figure 1: Distribution Wizard
In order to determine the ranking, the three tests are used in conjunction with weights assigned to each test.
Detailed results of the calculations can be found on the Initial sheet of the Analysis Details page, as shown in Figure 2.
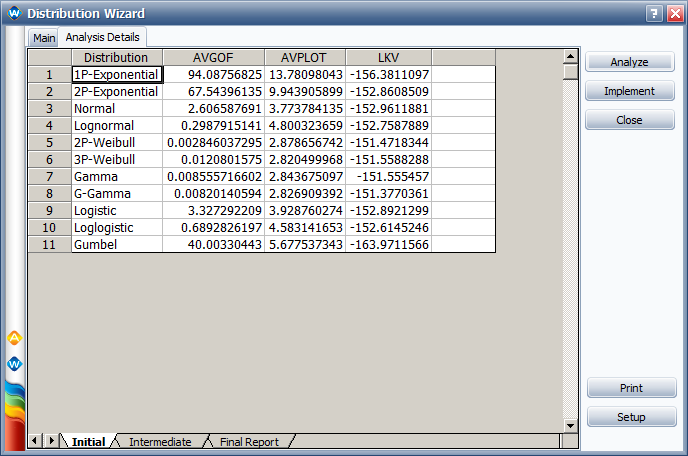
Figure 2: Analysis Details Initial Results
The second column, AVGOF, contains values obtained using the Kolmogorov-Smirnov (K-S) test. The third column, AVPLOT, provides the results of the second test, which is a normalized correlation coefficient (rho). The fourth column, LKV, contains the likelihood values.
On the Intermediate sheet of the Analysis Details page, these values are then weighted and combined into one overall value, DESV, as shown in Figure 3.

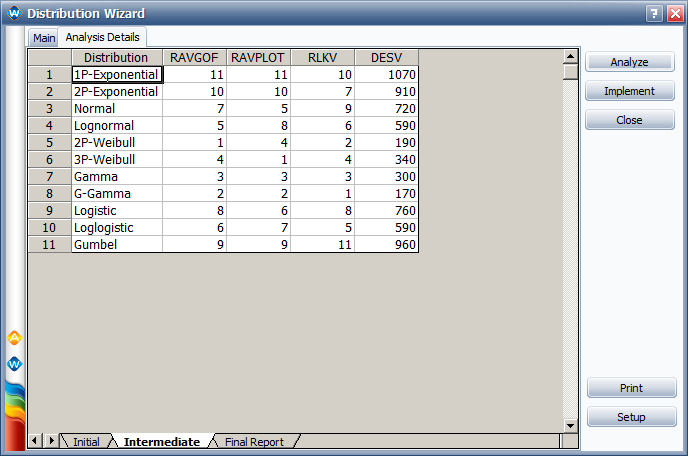
Figure 3: Analysis Details Intermediate Results
The weight (or importance) assigned to each test can be defined by the user. Clicking the Setup button opens the Distribution Wizard Setup window, as shown in Figure 4.
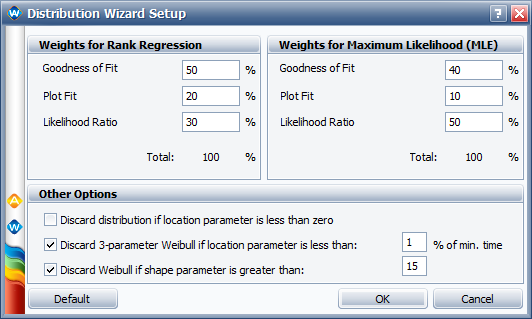
Figure 4: Distribution Wizard: Advanced Setup Window
The weights defined in this window are used in the DESV calculation. Note that the user can specify different weights depending on whether the parameter estimation method is rank regression or MLE.
Once DESV values have been calculated for each distribution, they are then used to determine overall rankings for the selected distributions.
Example Using the Distribution Wizard
Assume the following data are available:
| Time-to-failure, hrs |
| 10 |
| 30 |
| 50 |
| 60 |
The Distribution Wizard will calculate AVGOF, AVPLOT and LKV for each distribution selected for consideration and then obtain an overall rank for each one of them. As an example, lets calculate these values for the exponential distribution when using least squares or rank regression on X (RRX). For more information on these parameter estimation methods, see https://help.reliasoft.com/reference/life_data_analysis/lda/parameter_estimation.html#LeastSquaresRankRegression and https://help.reliasoft.com/reference/life_data_analysis/lda/parameter_estimation.html#MaximumLikelihoodEstimationMLE, respectively. Note that the parameters obtained via these methods are different and therefore the values of AVGOF, AVPLOT and LKV are different in each case.
Results using RRX
Given the data available, estimation of the exponential distribution parameter using rank regression on X results in Lambda equal to 0.02613.
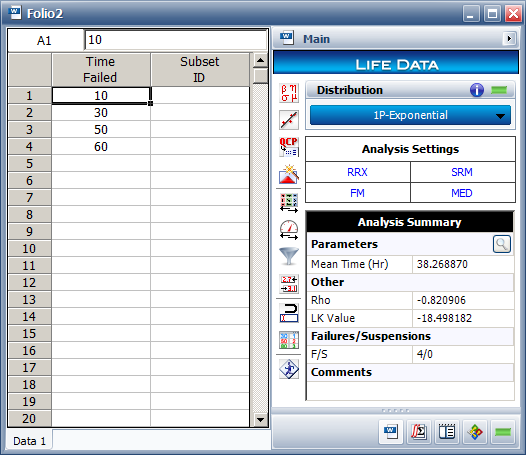
Figure 5: Data Folio
The K-S statistical test can be performed such that the null and alternative hypotheses are:
- H0: the distribution represents the data
- H1: the distribution does not represent the data
The K-S test statistic (D) is the maximum difference between the observed and predicted probability:
![]()
where:
-
 = observed probability
 -
 = predicted probability based on the distribution
 - N = number of observations
For this example:
| Time-to-failure, hrs |
Observed Probability, |
Predicted Probability, |
Absolute Difference |
| 10 | 0.15910 | 0.22996 | 0.07086 |
| 30 | 0.38573 | 0.54339 | 0.15766 |
| 50 | 0.61427 | 0.72925 | 0.11498 |
| 60 | 0.84090 | 0.79151 | 0.04939 |
Note that observed probability is calculated using median ranks. For more details on median ranks, refer to https://help.reliasoft.com/reference/life_data_analysis/lda/parameter_estimation.html#LeastSquaresRankRegression. The predicted probability is calculated using the distribution selected and the parameter(s) estimated (exponential with Lambda = 0.02613). The difference between those two values is calculated and the largest absolute difference is D. From the calculations above:
![]()
In many statistical textbooks, tables are available that tabulate critical values for the K-S test for different distributions [1, Appendix G]. For example, for a significance level of a = 0.1 and four data points:
![]()
Since D < Dcrit, then at a significance level of 0.10, H0 cannot be rejected.
Weibull++ calculates the critical probability at which we cannot reject H0:
![]()
where d is a random variable that follows the distribution of D. Note that AVGOF = 1 - p-value.
Large values of AVGOF, close to 1, indicate that there is a significant difference between the theoretical distribution (the one we are trying to test) and the data set.
For the exponential distribution (from Figure 2):
![]()
The plot fit, AVPLOT, is given by:

Using the values calculated previously:
![]()
The last term is the log of the likelihood value obtained with the estimated parameters (see Figure 5). More information on the likelihood function can be found at https://help.reliasoft.com/reference/life_data_analysis/lda/parameter_estimation.html#MaximumLikelihoodEstimationMLE.
![]()
Once all test results have been calculated for each distribution, distributions are ranked for each test, as shown in Figure 2. In this example, the exponential distribution ranks 8th when using AVGOF, 10th when using the AVPLOT and 11th when using LKV. A weighted solution is then obtained. Using the weights assigned to each of the tests, as shown in Figure 4, the weighted average can then be calculated, as shown in Figure 3.
![]()
Distributions are then ranked by values of DESV, the lowest value being ranked as number 1. In this example, the number 1 ranking distribution is the generalized gamma distribution.
References
[1] Kececioglu, Dimitri, "Reliability
and Life Testing Handbook Vol. 1," 1993.
[2] ReliaSoft Corporation,
Life
Data (Weibull) Analysis Reference, ReliaSoft Publishing, Tucson, AZ, 2008.