Throughput Analysis (Part II)
[Editor's Note: This article has been updated since its original publication to reflect a more recent version of the software interface.]
In last month's issue of the HotWire, the Throughput Analysis (Part I) article presented some basic throughput analysis concepts. Part II of this article will continue with the throughput analysis discussion by presenting a more complex scenario that incorporates the reliability and maintenance properties of the blocks and system. These are important factors that need to be incorporated when conducting a complete throughput analysis.
Example
To illustrate failures and repairs and their effects on system throughput, consider the simple system shown in Figure 1.

Figure 1: Simple system
The deterministic failure and repair characteristics are presented in Table 1.

Table 1: Deterministic failure and repair characteristics
To conduct the simulation in BlockSim, the following properties need to be set:
- Set all units to operate through system failure.
- Do not add spare part pools or crews (use defaults).
- Do not send units to failed blocks.
- Use a weighted allocation scheme.
The block and system behavior from 0 to 100 time units is shown in Figure 2.
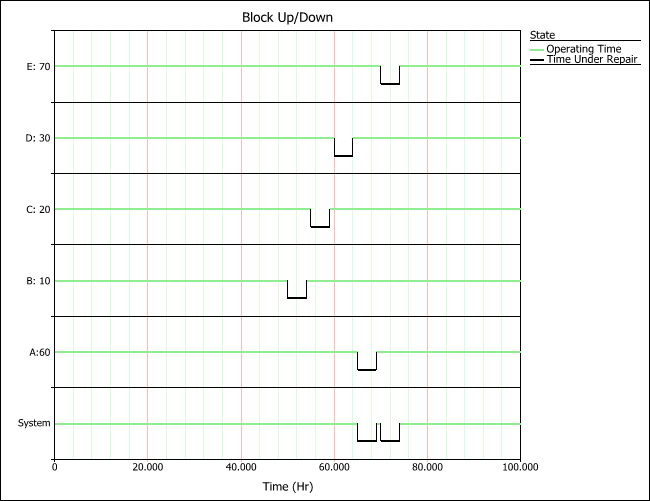
Figure 2: Block and system behavior from 0 to 100 time units
In addition, the event history for each block is shown in Table 2.
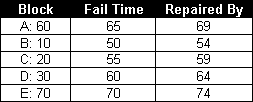
Table 2: Event history for each block
Once the system history has been established, the throughput behavior of the system can be examined from 0 to 100 time units by observing the sequence of events and their subsequent effect on the system throughput. Each event, along with its associated system throughput, will be presented next.
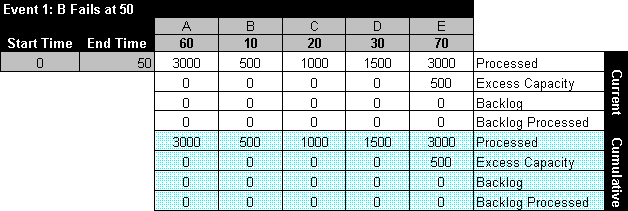
Event 1: B Fails at 50
The event overview is as follows:
- B fails at 50.
- From 0 to 50, A processes 3000 (60*50) items.
- 500 items are sent to B, 1000 to C and 1500 to D. There is no excess capacity at B, C or D.
- B, C and D process and send 3000 items to E. Because the capacity of E is 3500, E now has an excess capacity of 500.
The next table summarizes these results.
Event 2: B is Down 50 to 54
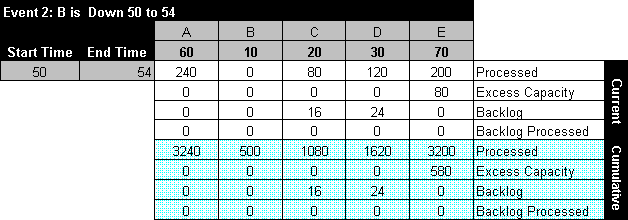
The event overview is as follows:
- B is down from 50 to 54.
- A processes 240 items and sends 96 to C and 144 to D.
- D and C can only process 80 and 120 items, respectively, during this time. Thus, they get a backlog of 16 and 24, respectively.
- The 200 items processed are sent to E. E has an excess capacity of 80 during this time period.
The next table summarizes these results.
Event 3: All Units Operating 54 to 55
The next table summarizes event 3.

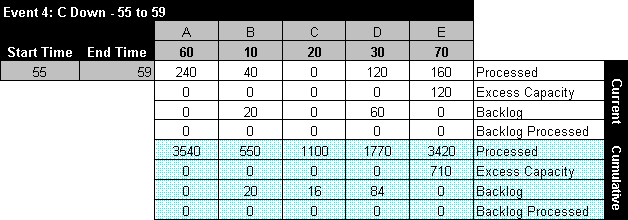
Event 4: C is Down 55 to 59
The next table summarizes event 4.
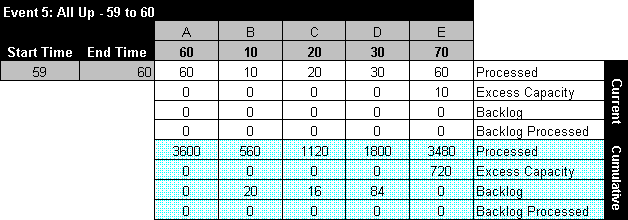
Event 5: All Units Operating 59 to 60
The next table summarizes event 5.
Event 6: D is Down 60 to 64
The next table summarizes event 6.

Event 7: All Units Operating 64 to 65
The next table summarizes event 7.

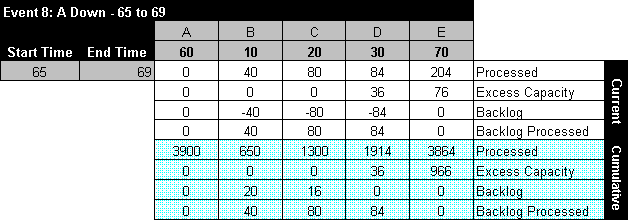
Event 8: A is Down 65 to 69
A is not operational between 65 and 69. This stops the flow of items in the system and provides an opportunity for the other blocks to process items in their backlog. For instance, while A is down B processes 40 items from the 60 items in its backlog.
Event 9: All Units Operating 69 to 70
The next table summarizes event 9.

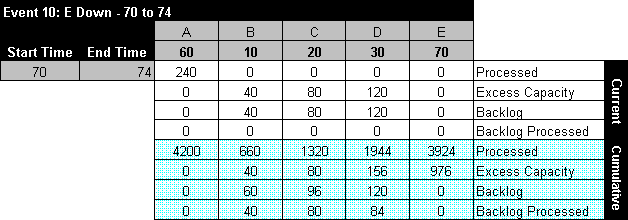
Event 10: E is Down 70 to 74
E is not operational from 70 to 74. Since we specified that we will not send items to failed units, B, C and D receive items from A but they do not process them since processing would require that items be sent to E. The items received by B, C and D are added to their respective backlogs. Furthermore, and since they could have processed them if E had been up, all three blocks have an excess capacity for this period.
Event 11: All Units Operating 74 to 100
The next table summarizes event 11.

Results
BlockSim provides all of these results via the Results Explorer. Figure 3 displays the system throughput summary.
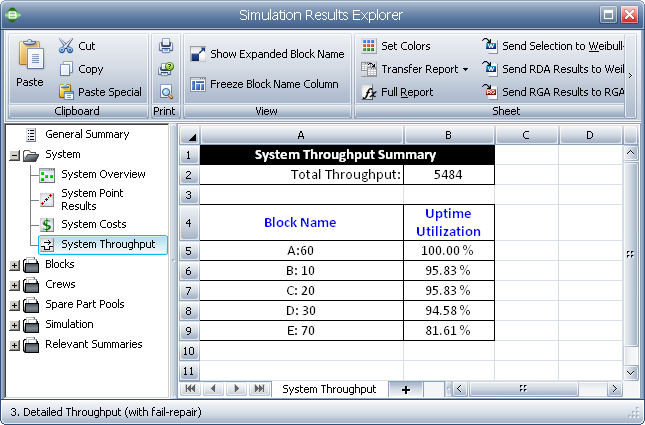
Figure 3: Summary of system throughput
The total system throughput is 5,484 items for this example. Additionally, the results include the uptime utilization of each component. The block level result summary, shown in Figure 4, provides additional results for each block.
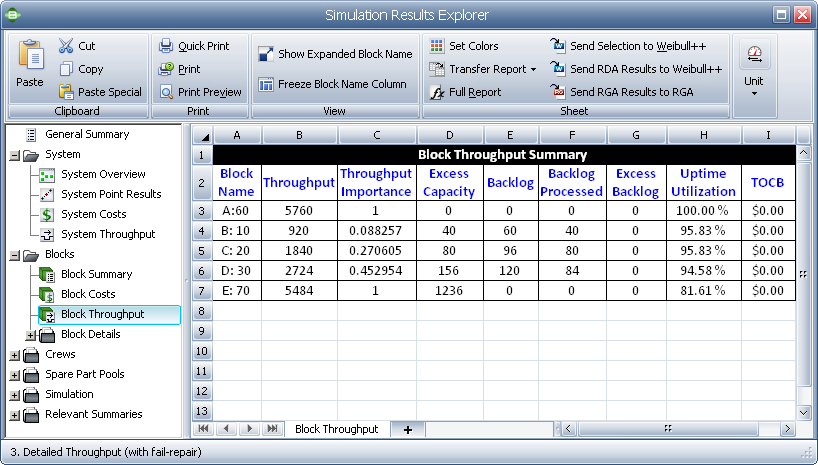
Figure 4: Block throughput summary
The number of items processed by each block is shown in the Throughput column. Specific throughput results and metrics are also available for each block, as shown in Figure 5.
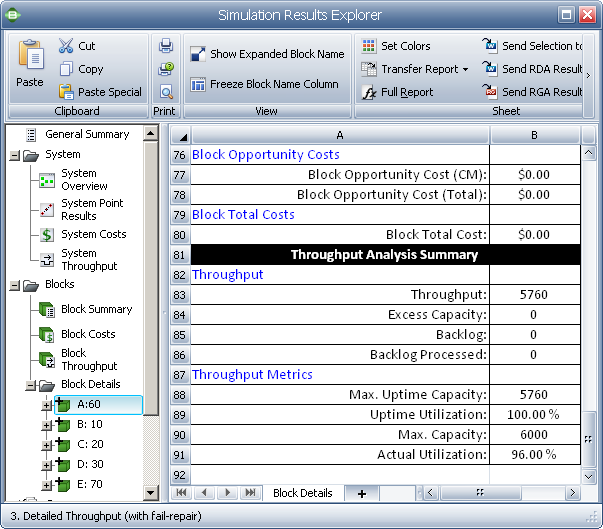
Figure 5: Throughput results and metrics for block A
The results for the other blocks can be viewed by selecting the appropriate block under the Block Details folder in the Results Explorer navigation panel.