Throughput Analysis (Part I)
[Editor's Note: This article has been updated since its original publication to reflect a more recent version of the software interface.]
Throughput analysis allows you to analyze a reliability block diagram
(RBD) such that each component within the system is designed to process
(make) something while it is in operation. Part I of this article will
introduce some throughput metrics and terminology. In addition, some basic
analysis using throughput and how this can be accomplished in
BlockSim will also be discussed. Part II will be presented in next
month's issue of the HotWire and will explore more complex scenarios
regarding throughput analysis.
Introduction
As an example, consider a case with two components in series and each processing/producing 10 and 20 items per unit time (ipu), respectively.

In this case, the system configuration is not only the system's reliability-wise configuration but also its production/processing sequence. In other words, the first component processes/produces 10 ipu and the second component can process/produce up to 20 ipu. However, the second component can only process/produce items it receives from the block before it and it is only receiving 10 items in this case. If we assume that neither component can fail, then the maximum items processed from this configuration would be 10 ipu. If the system operates for 100 time units, then the throughput of this system will be 1,000 items (10*100).
Metrics and Terminology for Throughput Analysis
Some of the terminology and metrics that describe the behavior of the system and its components when doing throughput analyses need to be defined. Some of this terminology, as used in BlockSim, is given next.
- System Throughput: The total amount of items processed/produced by the system over the defined period of time. In the two component example, this is 1,000 items over 100 time units.
- Component Throughput: The total amount of items processed/produced by each component (block). In the two component example, this is 1,000 items each.
- Component Maximum Capacity: The maximum number of items the component (block) could have processed/produced. This is simply the block's throughput rate times the run time. In the two component example, this is 100 x 10 = 1,000 for the first component and 100 x 20 = 2,000 for the second component.
- Component Uptime Capacity: The maximum number of items the component could have processed/produced while it was up and running. In the two component example, this is 1,000 for the first component and 2,000 for the second component since we are assuming that the components cannot fail. If the components could fail, this number would be the component's uptime times its throughput rate.
- Component Excess Capacity: The additional amount a component could have processed/produced while up and running. In the two component example, this is 0 for the first component and 1,000 for the second component.
- Component Actual Utilization: The ratio of the component throughput and the component maximum capacity. In the two component example, this is 100% for the first component and 50% for the second component.
- Component Uptime Utilization: The ratio of the component throughput and the component uptime capacity. In the two component example, this is 100% for the first component and 50% for the second component. Note that if the component had failed and experienced downtime, this number would be different.
- Backlog: Items
that the component could not process are kept in backlog. Depending on
certain settings in BlockSim, backlog may or may not be processed when
an opportunity arises. There are several backlog metrics, as outlined
next:
- Component Backlog: The amount of backlog present for the component at the end of the run (simulation).
- Component Processed Backlog: The amount of backlog processed by the component.
- Excess Backlog: Under certain settings within BlockSim, components can only accept a limited backlog. In these cases, backlog that was rejected is stored in the "Excess Backlog" category.
Overview
To examine throughput, consider the following two scenarios.
Scenario 1
Consider the system shown in Figure 1.
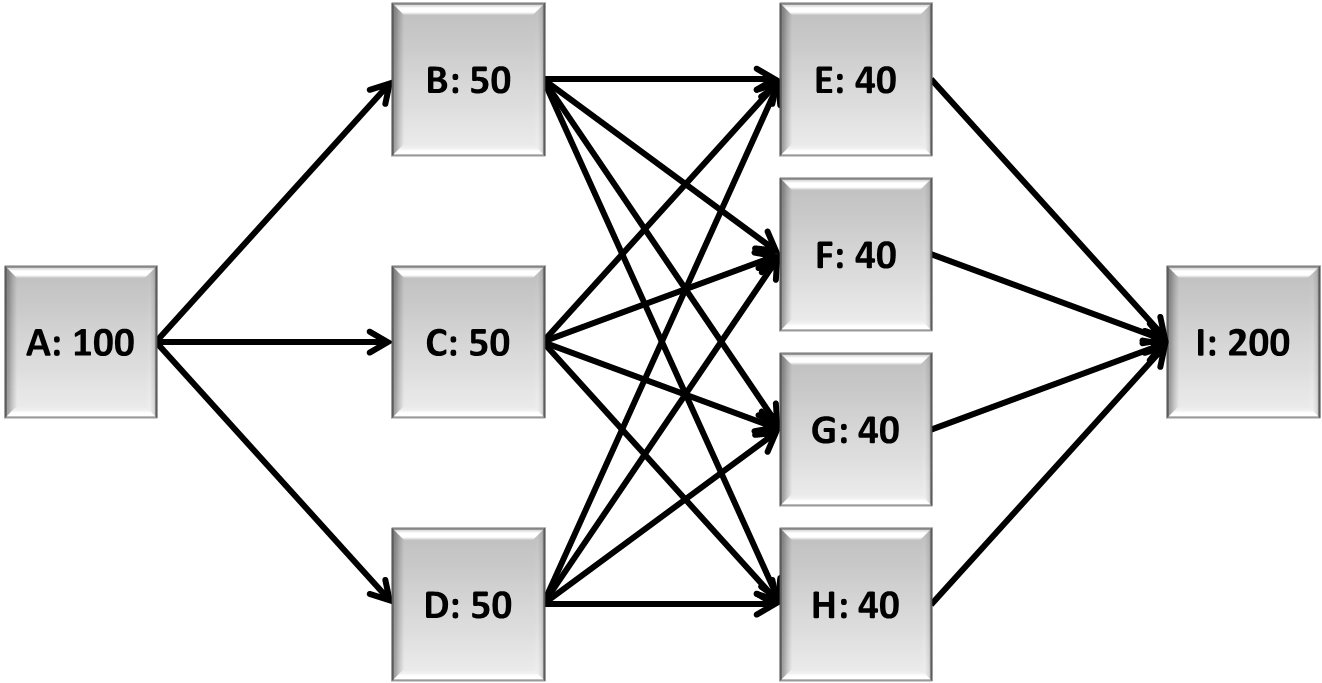
Figure 1: Throughput RBD of system for Scenario 1
Blocks A through I produce a number of items per unit time, as identified next to each letter (e.g. A: 100 implies 100 units per time unit for A). The connections shown in the RBD display the physical path of the items through the process (or production line). For the sake of simplicity, also assume that the blocks can never fail, that items are routed equally to each path and that items are not sent to failed blocks.
Therefore, this implies that over a single time unit, the following occurs:
- Unit A makes 100 items and routes 33.33 items to B, 33.33 items to C and 33.33 items to D.
- In turn B, C and D route their 33.33 items to E, F, G and H (8.33 items to each path).
- E, F, G and H route 25 items each to I.
- I processes all 100 items.
- The system produces 100 items.
Thus, Table 1 would represent the throughput and excess capacity of each block after 1 time unit.
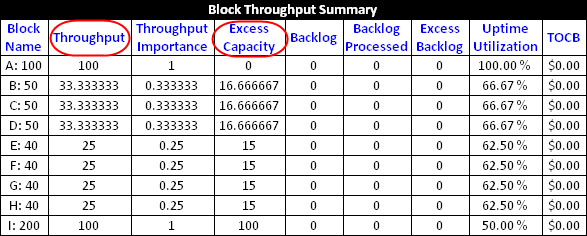
Table 1: Block throughput summary for Scenario 1
Scenario 2
Now consider the same system presented in Scenario 1, but both E and H have failed, as shown in Figure 2.
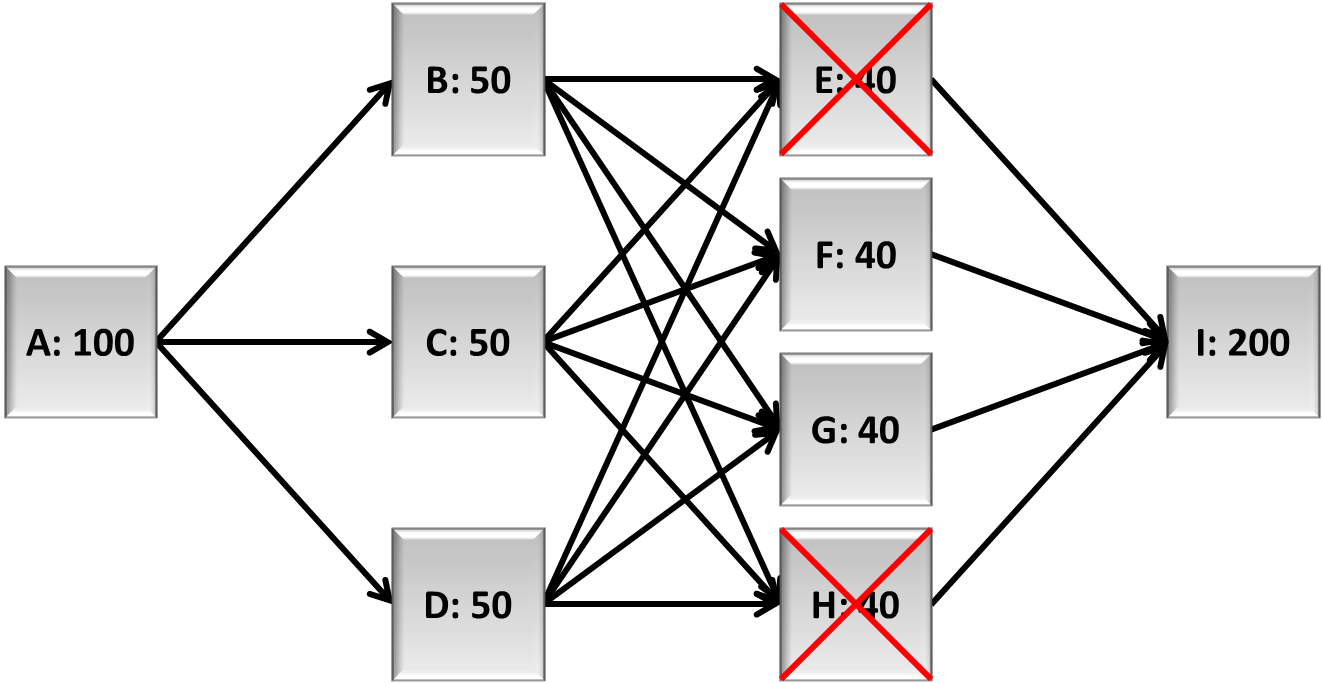
Figure 2: Throughput RBD of system for Scenario 2
Therefore:
- Unit A makes 100 items and routes 33.33 items to B, 33.33 items to C and 33.33 items to D.
- In turn, B, C and D route their 33.33 items to F and G (16.66 items to each path that has an operating block at the end).
- F and G get 50 items each.
- F and G process and route 40 items each (their maximum processing capacity) to I. Both have a backlog of 10 items because they could not process all 50 items they received.
- I processes all 80 items.
- The system produces 80 items.
Table 2 presents the block throughput summary for Scenario 2, including the utilization.
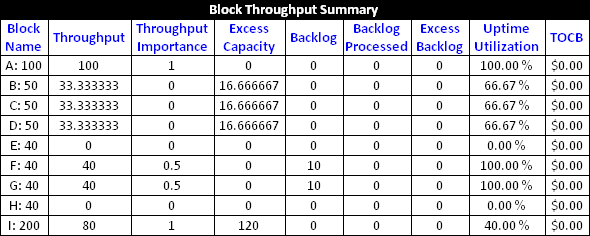
Table 2: Block throughput summary for Scenario 2
It can be seen from these results that the "bottlenecks" in the system are blocks F and G.
Throughput Analysis Options
The throughput properties that can be set at the block level within BlockSim are shown in Figure 3.
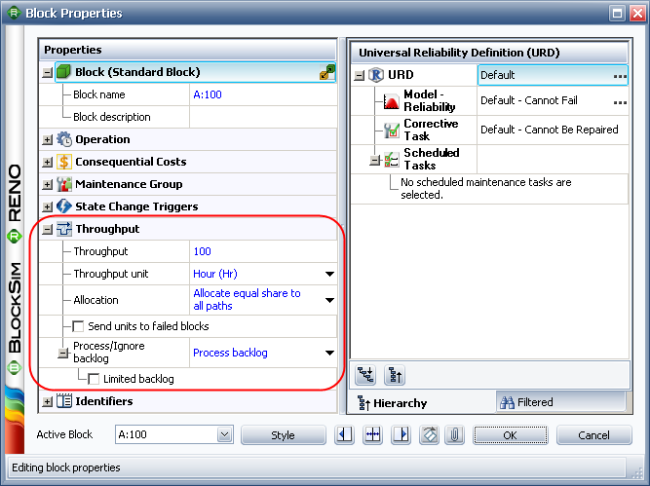
Figure 3: Block throughput settings
- Throughput and Throughput unit allow you to enter the quantity of output and the units used for time.
- Allocation allows you to specify how the output is routed if multiple outgoing paths from the block exist (i.e., equal or weighted).
- If there is more than one block that can receive units and one of those blocks has failed, the units will form a backlog for the failed block if the Send units to failed blocks option is selected. If it is not selected, the failed block will not receive any of the units and the entire stream will be distributed among the unfailed blocks.
- Units that a block cannot process, either because it is failed or because the units are in excess of its processing capacity, are kept in backlog. The Process/ignore backlog field allows you to specify whether backlogged units, if any, are processed or ignored.
- If you have selected to process backlog, you can select the Limited backlog option to place a limit on the number of units that can be stored in the backlog. Once the limit that you specify is reached, no additional units are added to the backlog.To illustrate this, reconsider Scenario 2, but with both F and G having a limited backlog of 5 units. After a single time unit of operation, the results would be as shown in Table 3.
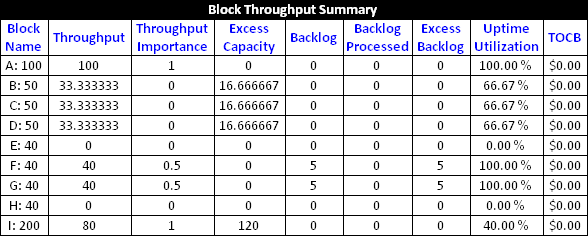
Table 3: Block throughput summary of Scenario 2 with F and G with limited backlog (1 time unit)
After two time units, the results are presented in Table 4.
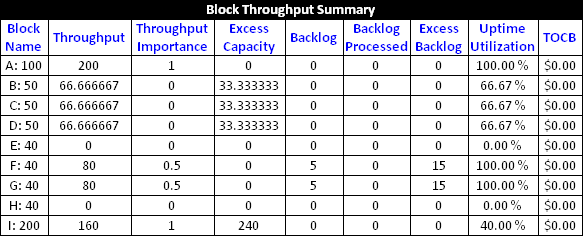
Table 4: Block throughput summary of Scenario 2 with F and G with limited backlog (2 time units)
Note that in this example, the units will never be able to process the backlog. However, if we were to observe the system for a longer time of operation and through failures and repairs of the other blocks, there would be opportunities for the blocks to process their backlogs and catch up. It is very important to note that when simulating a system with failures and repairs in BlockSim, you must define the block as one that operates through system failure if you wish for backlog to be processed. If this is not defined, then the block will not operate through system failure and, thus, will not be able to process any backlog when components that cause system failure (from an RBD perspective) fail.
As noted above, you can also specify the allocation scheme across multiple paths (equal or weighted) and decide if the items should be sent to failed parts. To explain these settings, consider the following system.
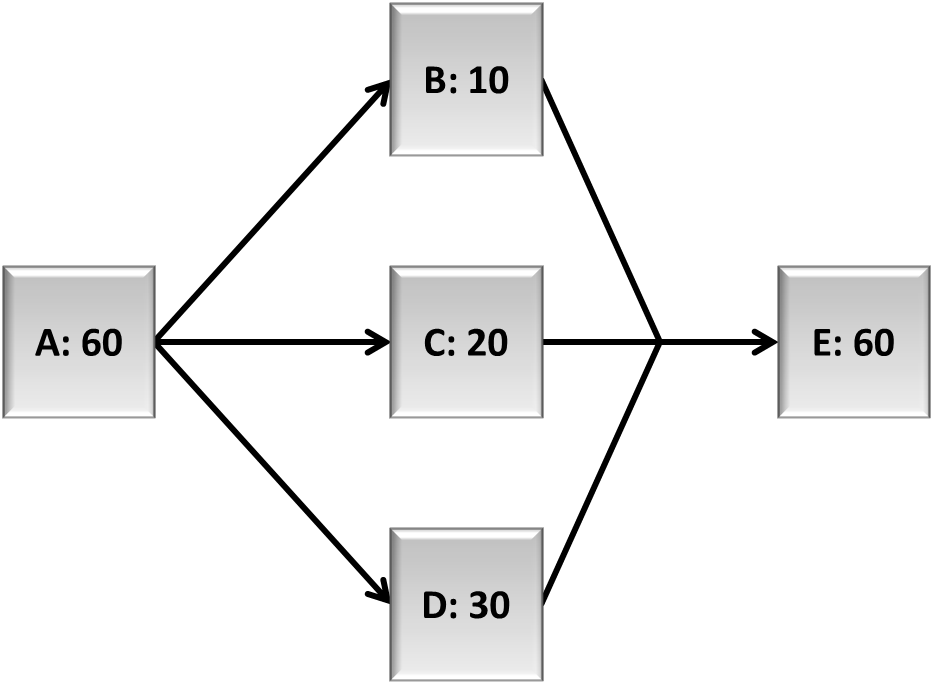
If the Weighted allocation across paths option is selected, then the 60 items made by A will be allocated to B, C and D based on their throughput capabilities. Specifically, the portion that each block will receive, Pi, is:
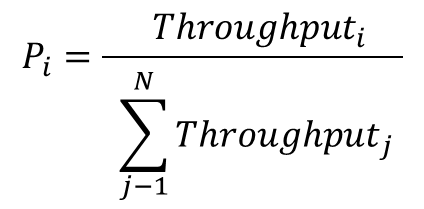
The actual amount is then
the portion times available units. In this case, B's portion is ![]() ,
C's portion is
,
C's portion is ![]() and D's portion is
and D's portion is ![]() .
When a total of 60 units are processed through A, B will get 10 units, C
will get 20 units and D will get 30 units. The results would then be as
shown in Table 5.
.
When a total of 60 units are processed through A, B will get 10 units, C
will get 20 units and D will get 30 units. The results would then be as
shown in Table 5.

Table 5: Weighted allocation results
If the Allocate equal share to all paths option is selected, then 20 units will be sent to B, C and D, regardless of their processing capacity, yielding the results shown in Table 6.

Table 6: Equal allocation results
If the Send units to failed blocks option is not selected, the throughput units are allocated only to operational blocks. Otherwise, if the option is selected, units are allocated to failed blocks and they become part of the failed block's backlog.
In the special case that a block (or blocks) fail causing a disruption in the path and the Send Units to Failed Blocks option is not selected, then the blocks immediately before the failed block(s) will not be able to process any items since the items cannot be sent to the forward block. In this case, these blocks will keep all items received in their backlog. As an example, consider the system in Figure 4. If E has failed (and E cannot accept any items in its backlog while failed) then B, C and D cannot forward any items to it. Thus, they will not process any items sent to them from A. Items sent from A will be placed in the backlog of items B, C and D.
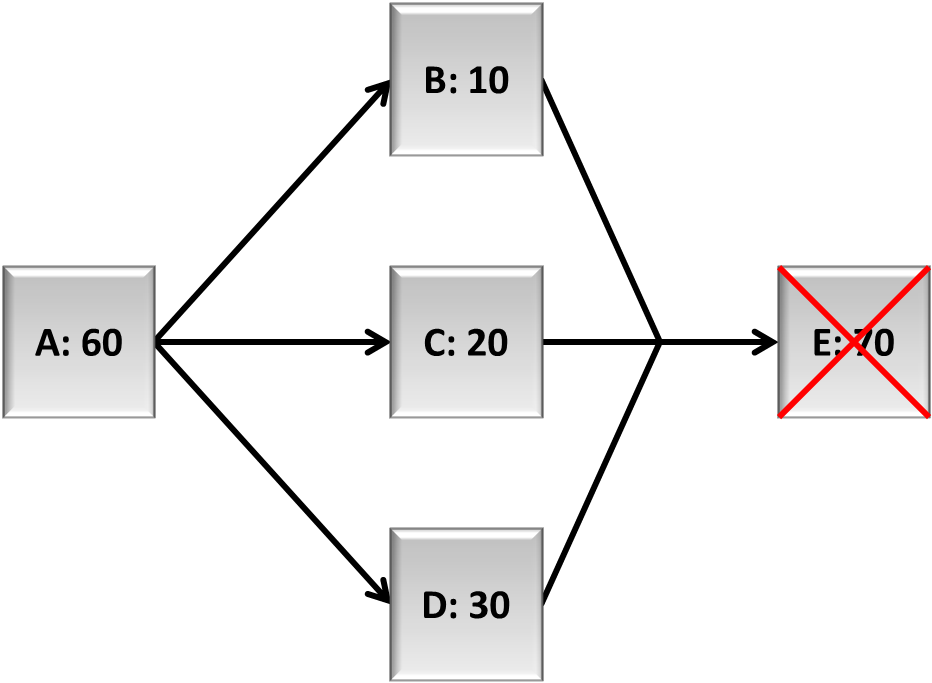
Figure 4: Illustrating a special backlog case
In next month's issue of the HotWire, we will continue the discussion of throughput analysis and how the reliability and maintenance properties of the blocks and the system are taken into account.