Extreme Value Distributions
Three types of asymptotic distributions have been developed for maximum and minimum values based on different initial distributions. These distributions are based on the extreme types theorem, and they are widely used in risk management, finance, economics, material science and other industries. In this article, we will introduce all three distributions. Two of them are of particular interest in reliability engineering: the type I asymptotic distribution for both maximum and minimum values (for minimum values, this is referred to as the Gumbel/Smallest Extreme Value (SEV) distribution in Weibull++), and the type III asymptotic distribution for minimum values (i.e., the well-known Weibull distribution).
Type I Distribution
The extreme value type I distribution has two forms. One is based on the largest extreme and the other is based on the smallest extreme. These two forms of the distribution can be used to model the distribution of the maximum or minimum number of the samples of various distributions. For example, if you had a list of maximum river levels for each of the past ten years, you could use the extreme value type I distribution to represent the distribution of the maximum level of a river in an upcoming year. This distribution is particularly useful in predicting the chance that an earthquake, flood or other natural disaster will occur.
The general formula for the pdf of the type I (minimum) distribution is:
![]()
where:
- μ is the location parameter.
- σ is the scale parameter.
When μ=0, σ=1, the above equation reduces to the standard Gumbel (minimum) distribution:
![]()
The reliability function of the Gumbel (minimum) distribution is given by:
![]()
The general formula for the pdf of the type I (maximum) distribution is:
![]()
When μ=0, σ=1, the above equation reduces to the standard Gumbel (maximum) distribution:
![]()
The reliability function of the Gumbel (maximum) distribution is given by:
![]()
Type II Distribution
The extreme value type II distribution, also known as the Fréchet distribution, is defined as:

where:
- α is the shape parameter.
- β is the scale parameter.
The reliability function of the extreme value type II is given by:
![]()
Type III Distribution
The extreme value type III distribution for minimum values is the well-known Weibull distribution. The two-parameter Weibull distribution is given by:

where:
- α is the shape parameter.
- β is the scale parameter.
The reliability function for the Weibull distribution is given by:
![]()
Example
This section provides an example to show how to use the Gumbel/SEV distribution to solve a problem in Weibull++.
A sample of 40 bearings from the same production lot is tested. These 40 bearings are randomly divided into 5 groups of 8 bearings each. The bearings in each group are tested simultaneously, and the test of each group is terminated when one bearing in that group fails. The times to the first failure of each group are given in Table 1.
Table 1 - Time to first failure for each of 5 groups of 8 bearings
| Order of Failure | Time to First Failure |
| 1 | 65 |
| 2 | 120 |
| 3 | 155 |
| 4 | 200 |
| 5 | 300 |
The times to first failure may be represented by the extreme value type I distribution for minimum values, so the Gumbel/SEV distribution can be used for calculation in Weibull++.
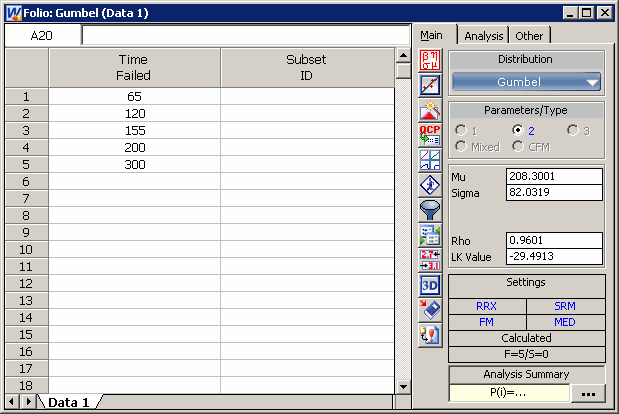
Enter the data from Table 1 into a Weibull++ standard folio using a data sheet for times to failure with no censoring and no grouping. Then calculate the data sheet using the Gumbel distribution and the RRX parameter estimation method, as shown in Figure 1:

Figure 1 - Gumbel/SEV
distribution in Weibull++
The calculated location parameter, μ, is 208.3001, and the scale parameter, σ, is equal to 82.0319.
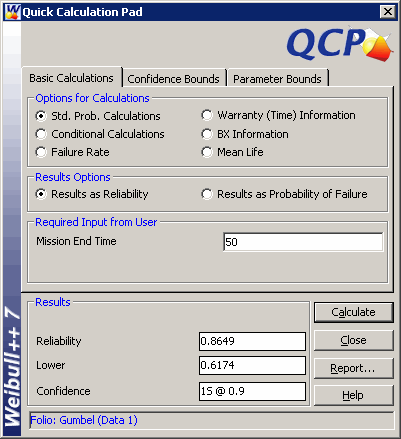
Based on this, the reliability of a product with 8 bearings in series for a mission of 50 hours with a 90% lower one-sided confidence bound can be obtained using the QCP, as shown in Figure 2.

Figure 2
- Reliability calculation in
QCP
Conclusion
In the article, we reviewed three types of extreme value distributions. The type I asymptotic distribution and the type III asymptotic distribution for minimum values are widely used in reliability engineering. The extreme value type I distribution has two forms: the smallest extreme (which is implemented in Weibull++ as the Gumbel/SEV distribution) and the largest extreme. The extreme value type III distribution for minimum values is actually the Weibull distribution. For more about the Weibull distribution, please see https://help.reliasoft.com/reference/life_data_analysis/lda/the_weibull_distribution.html.
References
Kececioglu, Dmitri, Reliability Engineering Handbook, Volume 1, Englewood Cliffs, NJ: Prentice-Hall, Inc., 1991.