Life Data Analysis (Weibull Analysis)
Visual Demonstration of the Effect of Parameters on the Distribution
As a supplement to the Life Data Analysis Basics quick subject guide, these three plots demonstrate the effect of the shape, scale and location parameters on the Weibull distribution probability density function (pdf).
Other life distributions have one or more parameters
that affect the shape, scale and/or location of the distribution in a
similar way. For example, the 2-parameter exponential distribution is
affected by the scale parameter, ![]() (lambda)
and the location parameter,
(lambda)
and the location parameter, ![]() (gamma). The shape of the exponential distribution is always the same.
(gamma). The shape of the exponential distribution is always the same.
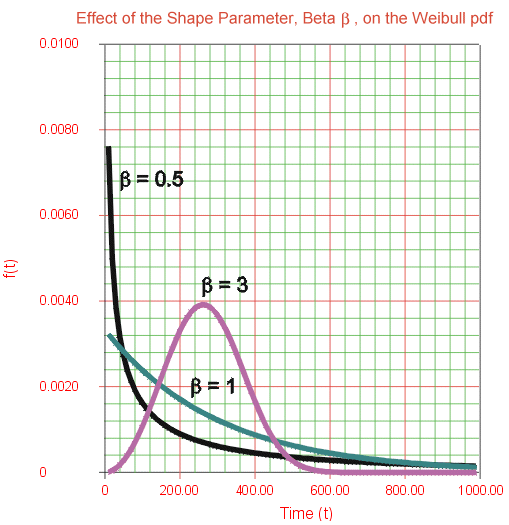
Weibull Shape Parameter
This plot demonstrates the effect of the shape parameter,
![]() (beta), on the Weibull distribution.
(beta), on the Weibull distribution.

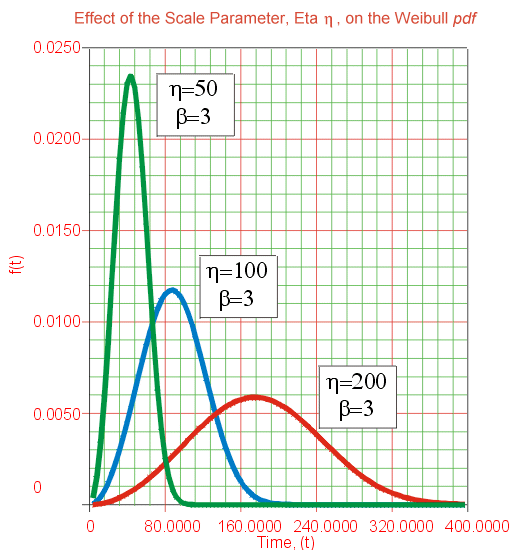
Weibull Scale Parameter
This plot demonstrates the effect of the scale parameter,
![]() (eta), on the Weibull distribution.
(eta), on the Weibull distribution.

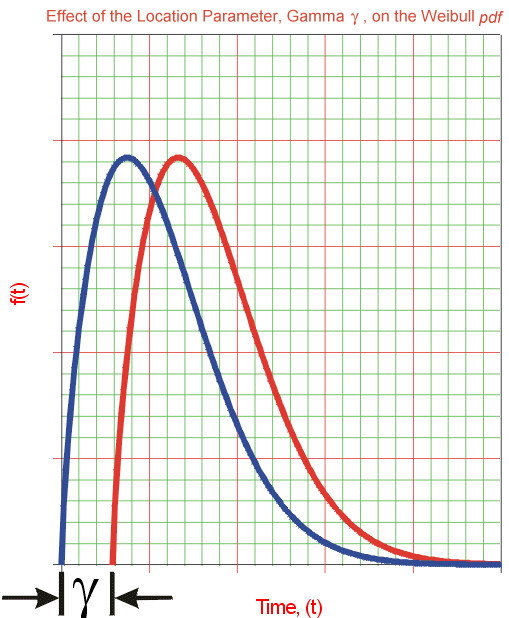
Weibull Location Parameter
This plot demonstrates the effect of the location parameter,
![]() (gamma), on the Weibull distribution.
(gamma), on the Weibull distribution.
