Interval Data Example

|
100 units of an electronic device are tested using two test chambers. Each test chamber contains 50 units and is set to a different temperature. The test is performed continuously for 15 weeks, but monitored only on a weekly basis; therefore, the exact times at which the units failed are unknown. For each failed unit, the only information available is whether or not it failed between inspections.
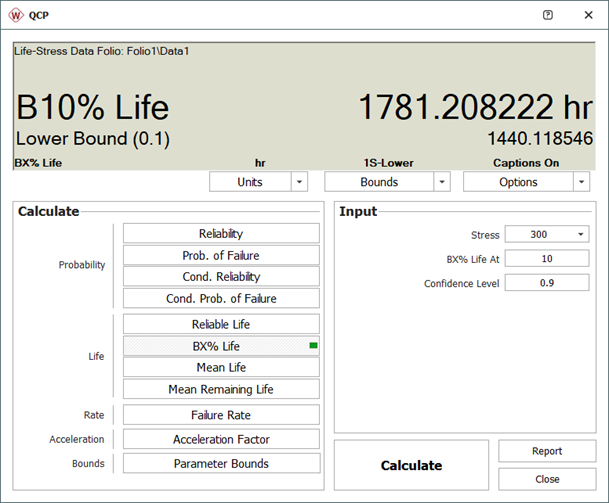
The goal of the test is to estimate the 90% lower bound on the
 life (in hours) of the electronic device. The data obtained from the test are recorded in an ALTA standard folio, using the interval data format, as shown next. The normal use condition is assumed to be 300K.
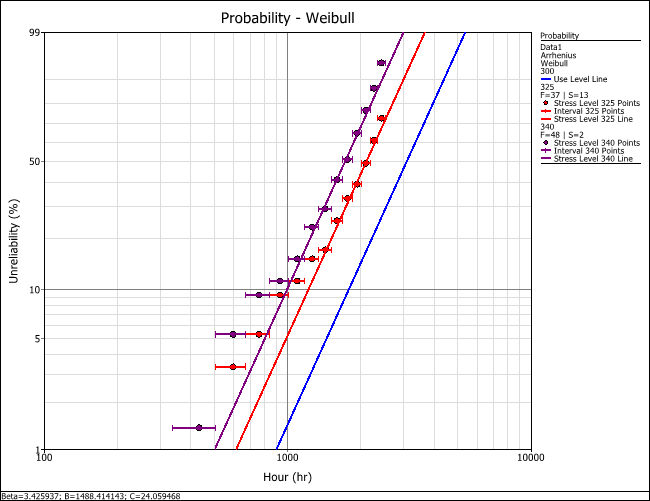
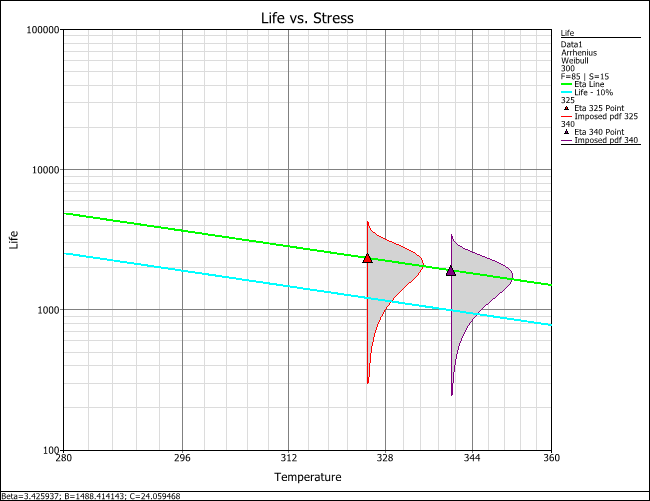
Assuming that the failure times of the device follow a Weibull distribution and that the Arrhenius model is an adequate life-stress relationship, we obtain the following estimates for the parameters:

The next figure show the probability lines at the different stress levels, along with the extrapolated use level probability line
The following Life vs. Stress plot shows the
 life line.
The 90% lower bound on the  life can be estimated as follows.