Serialized Page
The Serialized page allows you to view serialized system configurations. You can open the Serialized page in several ways:
- Click the System Configuration link in the summary area at the top of the Incident page for a serialized incident.
- Click the System Configuration link in the summary area at the top of the CSI page.
- Choose Options > Report > Serialized Search when working with the Report Builder then choose the system that you want to view.
![]()
System Configuration
The configuration for the selected system appears in the left panel. The part number, part description, version and serial number for each part in the configuration are displayed.
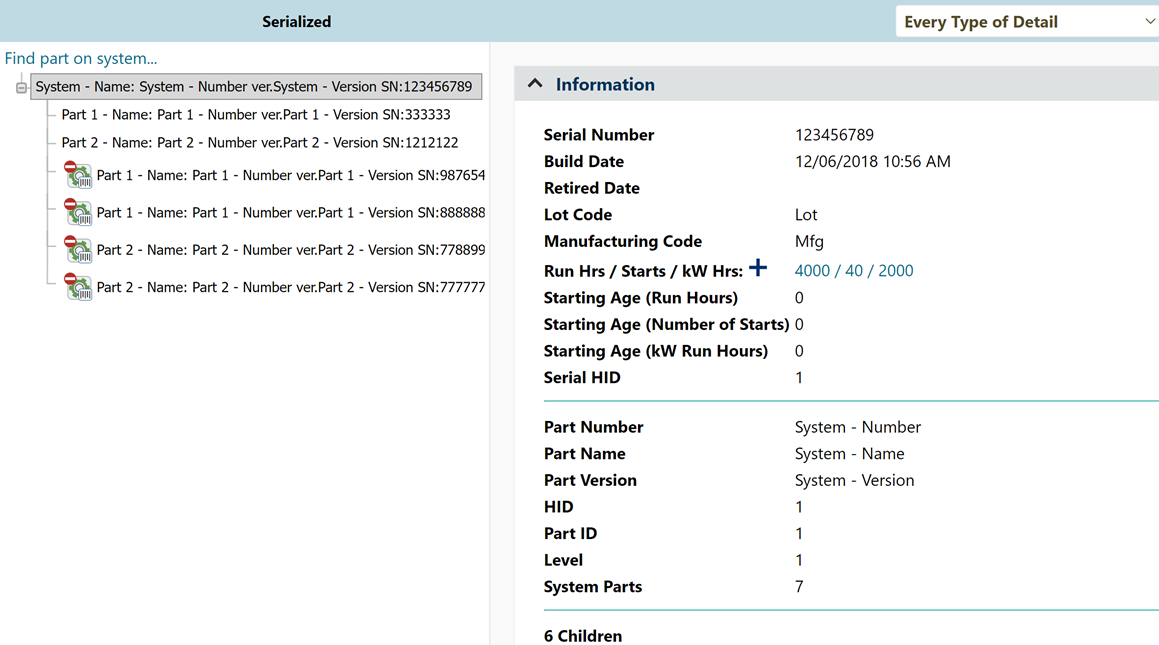
- To hide or display the parts below a part in the hierarchy, click plus (+) or minus (-).
- To locate a specific part, click the Find
part on system link at the top of the hierarchy to
search by part number, part description or serial number.
- If a part in the system configuration has been replaced, it will appear at the bottom of the hierarchy, with the retired date next to it.
- Retired parts are indicated by
 .
. - The Time Metrics Field area
displays up to three types of time measurements that have
been reported for the unit at the time of the incident. Note
that an application admin maintains the time metric field
names. Therefore, the name of the Time Metrics field used
in your implementation may be different and, depending on
the configurable settings for the current entity, this field
may display one, two or three time metrics. The default is
Run Hrs/Starts, which
displays the total system hours and the number of starts that
have been reported for the unit at the time of the incident.
You can click the Add
icon,
 , to add a report on system hours
and/or starts. You can click the link to display the System
Run Hours utility, which displays a summary of all system
hours and number of starts reports that have been made for
the unit. System hours reports that were made manually (i.e.,
that are not from an incident) can be deleted from this table.
, to add a report on system hours
and/or starts. You can click the link to display the System
Run Hours utility, which displays a summary of all system
hours and number of starts reports that have been made for
the unit. System hours reports that were made manually (i.e.,
that are not from an incident) can be deleted from this table.
- To view another serialized system, choose Home > Serialized > Serialized Search. In the Find System utility that appears, you can search by the system serial number or subsystem serial number.
Part Details
When you select a part, its details appear in the Information panel on the right side of the page.
Starting in Version 2021, these details include accumulated hours and other key information for parts that have been repaired or replaced. This is especially helpful for tracking these parts across systems when reusing them. The following information appears for each repair/replace occurrence:
- The part disposition
- Up to three time metrics — e.g., run hours, number of starts, kW run hours, etc. — depending on the configurable settings for the entity
- A link to the incident where the part was repaired or replaced

Related Topics and Links
- Attachments
- Send E-mail Utility
- Select Existing Utility
- Assign Team Members Utility
- Status Fields
- Part and Serial Number Selection Utilities