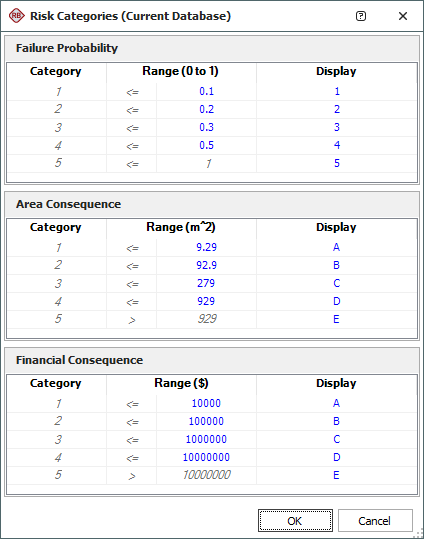
Risk Categories (Current Database)

The Risk Priority labels that are assigned on the Results tab from an RBI analysis (i.e., Low, Medium, Medium High and High) are determined based on two scoring matrices that can be customized to reflect the specific risk tolerance of your organization. Both scoring systems use the same 5-point scale to assign a rating based on the failure probability. In one, this is combined with a second 5-point scale that focuses on the financial consequences of failure (in terms of US dollars). In the other, the second 5-point scale focuses on the size of the surrounding area that might be affected if a containment failure occurs (in terms of square meters).
To view or modify the rating scales that will be used for all RBI analyses in the current database, choose System Hierarchy > Risk Based Inspection > Risk Categories.
![]()
For each 5-point rating scale, you can set the Range of values that determine which rating will be applied in the RBI analysis results. For example, with the default settings shown in the picture below, the application assigns the lowest (best case) rating of 1 if the calculated failure probability is between 0 and 0.1; whereas, the application assigns the highest (worst case) rating of 5 if the probability is between 0.5 and 1.
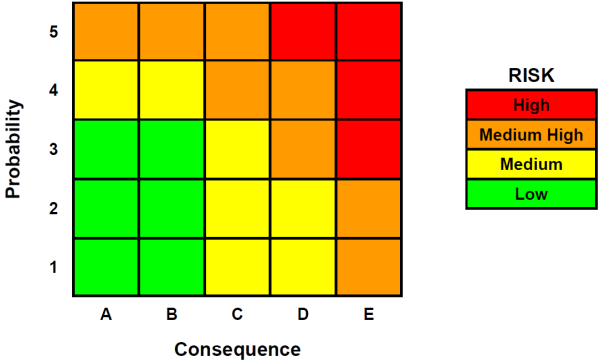
You also have the option to customize the Display preferences for these rating scales. For example, with the default settings shown in the picture, the failure probability ratings will be displayed in the RBI analysis results as numbers from 1 to 5, but the consequence ratings will be displayed as letters from A to E. Therefore, if the analysis indicates that the failure probability and consequence both fall into the lowest (best case) rating, the results will display 1 for the failure probability and A for the consequence, while the highest (worst case) ratings will display 5 and E, and so on. The application then uses the scoring matrix table shown below to apply applicable Risk Priority label (Low, Medium, Medium High or High).
When you click OK to save the changes, any existing RBI analysis will be updated automatically.
The Scoring Matrix
The following table shows the scoring matrix.