RPN Metrics in FMEAs, Reports and Plots
When you are working with an FMEA in the Analysis panel, the RPN metrics that have been enabled for a project (except QCPNs) will be displayed in the FMEA.
If you want to display these metrics in the FMEA hierarchy and filtered view, right-click the column headings then click Customize Columns. These settings are stored per computer/username in the FMEA Hierarchy page of the Application Setup.
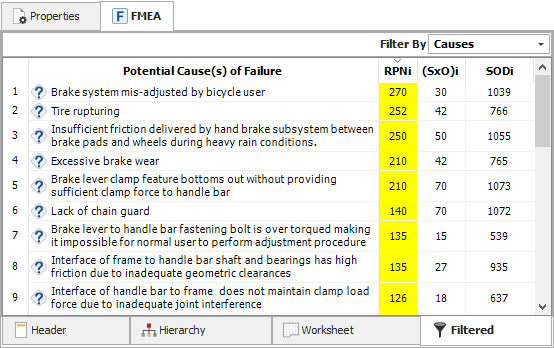
Here's an example that shows the causes sorted by initial RPN, and also shows the SxO and SOD.

Priority Highlights
In all three FMEA views, you also have the option to use color to highlight issues based on priority. Choose FMEA > Tools > Highlight Priority to turn the colors on or off.
![]()
The logic used to determine the priority for each issue is configurable and can be defined on the FMEA > RPNs page in the interface style for the project. The highlights can be based solely on the PRN values, or you can define a more complex risk ranking logic.
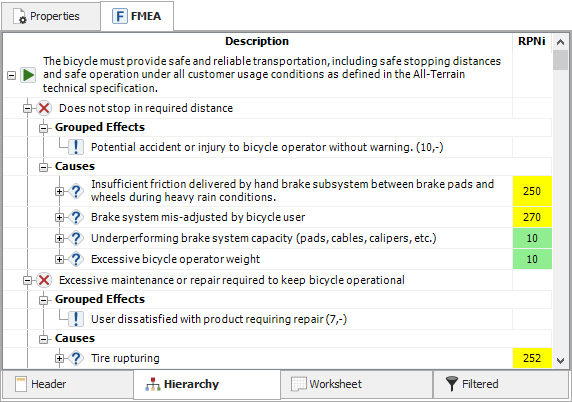
Here's an example that shows highlights based on initial RPN (High Priority >= 300, Low Priority <= 30).

Queries and Reports
Any of the RPN metrics that have been enabled in the project can be used in the queries and reports that you create.
To open the Query Utility, choose Home > Reporting > Queries.
![]()
To open the Reports window, choose Home > Reporting > Reports.
![]()
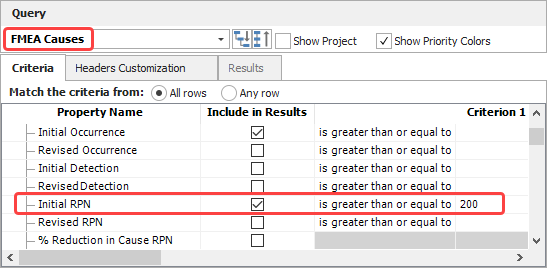
As an example, the following query creates a list of failure causes with an initial RPN greater than 200.

Plot Viewer
To open the Plot Viewer, choose Home > Reporting > Plots.
![]()
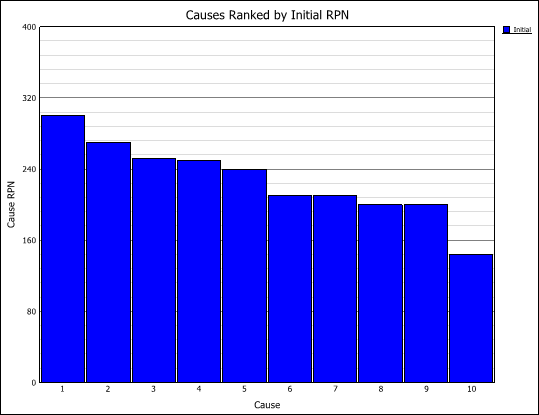
Refer to the FMEA Plots topic for a list of the available plot types and their descriptions. As an example, the following plot shows the top 10 causes ranked by their initial RPN value.
