Tests of Comparison Control Panel
The life comparison and stress-strength folios share the same control panel settings. The icons arranged vertically on the left side of the panel allow you to perform a variety of tasks related to the comparison (e.g., calculate the folio, select different data sheets, etc.), while the icons arranged horizontally perform tasks for each data set.
The control panel consists of two pages: the Analysis page, which contains most of the tools you will need to perform the analysis and view/access the results, and the Setup page, which contains options for setting how you want the probability value to be computed.
Note:
Information from the source data sheets are copied, not linked
to the analysis. This means that if changes were made to the data
sheets, you must re-select the data sheets to copy the new information
to the analysis. To re-select data sheets, click the ![]() icon on the control
panel.
icon on the control
panel.
Control Panel Analysis Page
The Analysis page of the control panel contains the following settings:
- The Results
area shows the calculated probability value. Click the Show Results (...) button
to display a report of the results.
- In the life comparison folio, the value represents the probability that the life of the second data set exceeds the life of the first data set (Probability X1<X2).
- In the stress-strength folio, the value represents the Reliability of the product (i.e., the probability that the product can withstand the applied stress). This can also be displayed as the Probability of Failure if you select the check box on the Setup page of the control panel.
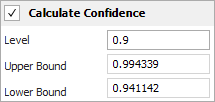
- The Calculate Confidence check box provides the option to compute the two-sided confidence bounds of the probability value. Enter the desired confidence level (in decimal) in the Level field, and then click the Calculate icon on the control panel to display the results in the Upper Bound and Lower Bound fields.
- The following settings affect how the plot is displayed:
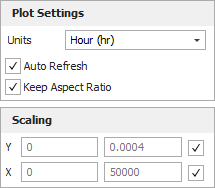
- The Units drop-down list allows you to choose the unit for the plot's time scale.
- The Auto Refresh check box automatically refreshes the plot if any of the data sets, inputs or settings are modified.
- The Keep Aspect Ratio check box maintains the ratio of the horizontal size to the vertical size of the plot graphic when you resize the plot sheet.
- The Scaling area shows the minimum and maximum values for the X and Y axes. You can change these values if the Auto Scale check box beside the value range is cleared. If it is selected, the application will automatically choose appropriate values for the range based on the current data.
- The control panel also displays the values of the parameters of the distribution for each data set. For the stress-strength comparison test (as shown in the picture below), the first data set represents the Stress and the second data set represents the Strength. For the life comparison test, these are displayed as Set 1 and Set 2.
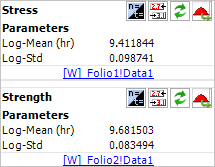
To see a summary report of the analysis for a data set, click anywhere within the parameters table. To open the folio, click the blue link that displays the name of the folio and data sheet.
Folio Tools
The folio tools are arranged on the left side of the Analysis page of the control panel and in the areas dedicated to the selected data sheets (e.g., the Stress area on the control panel, as shown in the previous picture). Use these tools to manage data and experiment with the results of your analysis.
![]() Calculate
calculates the probability value.
Calculate
calculates the probability value.
- In the life comparison folio, the value represents the probability that the life of the second data set exceeds the life of the first data set.
- In the stress-strength folio, the value represents the reliability of the product (i.e., the probability that the product can withstand the applied stress). This can also be displayed as the probability of failure if you select the check box on the Setup page of the control panel.
![]() Redraw Plot
updates the plot to reflect any changes that have been made.
Redraw Plot
updates the plot to reflect any changes that have been made.
![]() Plot Setup
opens the Plot Setup window, which
allows you to customize most aspects of the plot including the
titles, line styles and point styles.
Plot Setup
opens the Plot Setup window, which
allows you to customize most aspects of the plot including the
titles, line styles and point styles.
![]() RS Draw launches
ReliaSoft Draw, which allows
you to annotate your plot and view your plot in greater detail.
RS Draw launches
ReliaSoft Draw, which allows
you to annotate your plot and view your plot in greater detail.
![]() Export Plot Graphic
opens the Save As window, which allows you to save the current
plot graphic in one of the following formats: *.jpg, *.gif, *.png
or *.wmf.
Export Plot Graphic
opens the Save As window, which allows you to save the current
plot graphic in one of the following formats: *.jpg, *.gif, *.png
or *.wmf.
![]() Select Data Sheet
opens a window that allows you to select the data sheets to compare.
Select Data Sheet
opens a window that allows you to select the data sheets to compare.
![]() Target Reliability
Parameter Estimator opens the Target
Reliability Parameter Estimator window, which allows you to
explore how you could attempt to change one of the distribution
parameters in order to meet a specified target reliability. The
plot and probability value will be based on the altered distributions
and therefore may be appropriate only within the context of your
specific scenario.
Target Reliability
Parameter Estimator opens the Target
Reliability Parameter Estimator window, which allows you to
explore how you could attempt to change one of the distribution
parameters in order to meet a specified target reliability. The
plot and probability value will be based on the altered distributions
and therefore may be appropriate only within the context of your
specific scenario.
![]() Reliability Demonstration
Test opens the Reliability
Demonstration Test window, which allows you to solve for values
associated with a specified test design such as required test
time, required sample size, demonstrated reliability and confidence
level.
Reliability Demonstration
Test opens the Reliability
Demonstration Test window, which allows you to solve for values
associated with a specified test design such as required test
time, required sample size, demonstrated reliability and confidence
level.
![]() Alter Parameters (also called Alter
Parameters w/o Recalculation) allows you to manually alter the value of
one (or more) parameters, while keeping the original values of the rest
of the parameters and the variance/covariance matrix the same. The LK
value, the solution line on plots and all subsequent analyses will be
based on the modified set of parameters.
Alter Parameters (also called Alter
Parameters w/o Recalculation) allows you to manually alter the value of
one (or more) parameters, while keeping the original values of the rest
of the parameters and the variance/covariance matrix the same. The LK
value, the solution line on plots and all subsequent analyses will be
based on the modified set of parameters.
![]() Refresh Parameters
if you have manually modified the parameters of the data
set, this option allows you to revert to the parameters calculated
from the original data source.
Refresh Parameters
if you have manually modified the parameters of the data
set, this option allows you to revert to the parameters calculated
from the original data source.
![]() Transfer Parameters
allows you to transfer those modified parameters to the original
data source. All subsequent analysis made on the data source,
such as calculations made via the QCP and other tools, will be
based on the modified parameter values; therefore, the analysis
may be appropriate only within the context of your specific scenario.
Transfer Parameters
allows you to transfer those modified parameters to the original
data source. All subsequent analysis made on the data source,
such as calculations made via the QCP and other tools, will be
based on the modified parameter values; therefore, the analysis
may be appropriate only within the context of your specific scenario.
Control Panel Setup Page
The Setup page of the control panel contains options for setting how you want the probability value to be computed. The following picture shows the Setup page of a stress-strength folio.
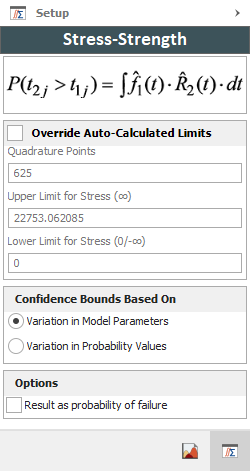
- The limits of the integral in the probability equation are from zero to infinity. You can change the limits by selecting the Override auto-calculated limits check box. If you select this option, the equation shown on the control panel (as shown in the picture above) will be used to obtain the result.
The ability to change the upper and lower limits of the integral gives you the option to limit your analysis to specific areas of interest. When you use a finite upper limit, the test excludes the outcomes where both products are expected to operate longer than the time specified by the upper limit. When you specify a lower limit, the test excludes the outcomes where both products are expected to fail before the time specified by the lower limit. For example, you might wish to set the lower limit to a time other than zero in order to exclude the burn-in period from the comparison. Likewise, you could set a specific time for the upper limit if you want to consider only the behavior that occurs while the product is under warranty.
The Quadrature Points field allows you to set the number of intervals (evaluation points) that the integral is divided into. Increasing the quadrature points increases the accuracy of the approximation but at the expense of increased calculation time.
- The comparison tools provide two methods for calculating
the confidence bounds, depending on whether the parameters
of the distributions were estimated from actual data, or based
on engineering knowledge or existing references. A brief description
of each method is provided next. For an in-depth discussion
on both calculation methods, the Life Data Analysis Reference
provides more information at: https://help.reliasoft.com/reference/life_data_analysis/lda/stress-strength_analysis.html.
Note that confidence bounds calculations are not possible when one or both data sheets is an Accelerated Life Testing life-stress data folio that uses stress profiles.- Variation in Model
Parameters. Select this option if the parameters
of both distributions are estimated from actual data.
Parameters that are estimated from actual data sets have
associated uncertainties that the software can use to
calculate the variance and confidence bounds on the estimated
probability. Note that this method is not supported if
one or both of the data sets meets any of the following
conditions:
- The data sheet has no data set (i.e., has fixed parameters).
- The data set is from a free-form data sheet.
- The data set is from an Accelerated Life Testing life-stress data folio that uses the cumulative damage model.
- The data set was not analyzed using Fisher Matrix confidence bounds.
- The distribution has parameters that were modified via the Alter Parameters tool or Target Reliability Parameter Estimator.
- Variation in Probability Values. Select this method if the parameters of either distribution are fixed values. The software will use the variations in the estimated probability values to obtain the variance and confidence bounds.
- Variation in Model
Parameters. Select this option if the parameters
of both distributions are estimated from actual data.
Parameters that are estimated from actual data sets have
associated uncertainties that the software can use to
calculate the variance and confidence bounds on the estimated
probability. Note that this method is not supported if
one or both of the data sets meets any of the following
conditions:
- The Result as probability of failure check box is available only in stress-strength folios. It allows you to display the probability of failure instead of the reliability.