Free Form Folio: Example
The data set used in this example is available in the example database installed with the software (called "Weibull24_DOE_Examples.rsgz24"). To access this database file, choose File > Help, click Open Examples Folder, then browse for the file in the Weibull sub-folder.
The name of the example project is "Free Form Folio - Optimization."
A chemical engineering experiment involving heat transfer was performed several weeks ago. There were some difficulties during the experiment (the factor values were difficult to control because of the testing equipment), and some of the test runs had to be discarded. While the testing facility will not be used for future experiments, the engineers would still like to analyze the old data and find the possible optimal values for each factor. They could then use the optimal values as a starting point for future experiments. The factors are:
- Fluidizing gas flow rate (lb/hr)
- Supernatant gas flow rate (lb/hr)
- Nozzle opening (mm)
- Gas temperature (F)
There are two responses: heat transfer efficiency and thermal efficiency. The objective of the analysis is to maximize both responses.
Data Entry
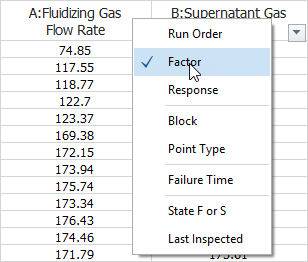
The data set (without the discarded test runs) is shown in the "Historical Data" free form folio. Each column of data was defined as a factor or response column by clicking the arrow in the column heading.

The factors and responses were then defined (e.g., the engineers named the factors/responses and specified that all the factors are quantitative) by clicking the Modify Design icon on the control panel.
![]()
Analysis and Results
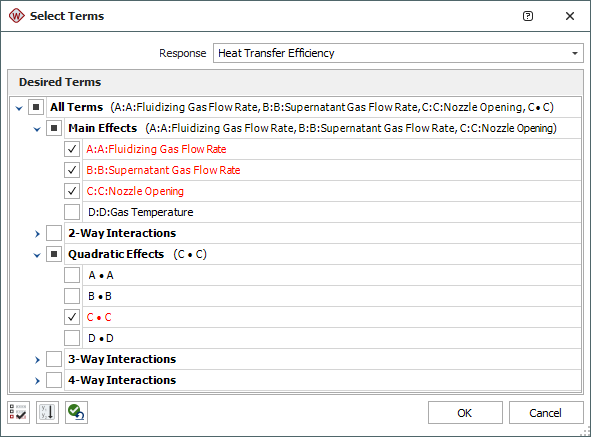
For terms to be included in the analysis of the heat transfer efficiency response were selected by clicking the Select Terms icon.
![]()
The Heat Transfer Efficiency was chosen from the drop-down list at the top of the window, and the following terms were selected.
For the second response, the main effects of factors A, B and D were selected; the interaction effects AB and BD were selected; and the quadratic effects AA and DD were selected. Click the Calculate icon to analyze both responses.
![]()
The regression table for heat transfer efficiency is shown next:
Next is the regression table for thermal efficiency:
Now that models have been created for both responses, you can use the optimization folio to investigate how different factor level combinations affect the response values. (See Optimization Example.)


