Project Plan Summary Panel
The project plan summary panel displays information about start/completion dates, status, progress and resource usage for an entire project plan, and for individual gates and actions.
The summary panel is accessible from multiple locations across the ReliaSoft desktop application:
- From the Project Planner, you can select a gate or action in the hierarchy to view its summary, or you can select the project at the top of the hierarchy to view a summary of the entire plan.
- The gate/action properties window shows the summary for that gate/action.
- The Plan Summary Page in My Portal displays a summary of the entire plan for the project that currently has focus.
- These summaries are also displayed in the SEP web portal, if it is implemented for an enterprise database.
|
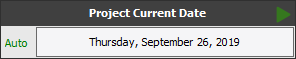
In most cases, this shows the
current date. If you are working in the Project Planner
and you want to see what the statuses would be on a different
date, click the green "play" arrow ( |
|
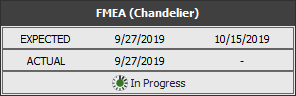
This bar displays the name of the project, gate or action that the summary applies to, followed by:
|

|
For actions, the progress bar shows the percentage entered by the user. For gates, it shows the percentage of the total duration of dependent actions/gates that is complete. For example, if Action 1 (duration = 3 days) is complete and Action 2 (duration = 1 day) is incomplete, the progress is 75%. |
|
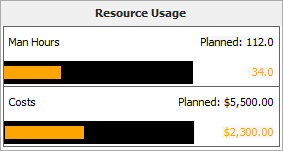
For resource usage, the black bars show the planned man hours and costs. The colored bars show either the expected usage to date (estimated based on the number of days in progress), or the actual usage if complete. (See Costs and Man Hours.)
|

|
The pie chart will be visible only for projects or gates that have at least one action assigned (either directly or via dependent gates).
|
Related Topics and Links