Project Plan Hierarchy
In the Project Planner, the plan consists of gates arranged in a tree-based hierarchy to represent the different phases of a process. You can also include action resources that represent specific assignments that need to be performed. For example, the configuration below shows a plan with five top-level gates (Concept Phase, Design Phase, etc.), where each gate has its own sub-gates and actions.
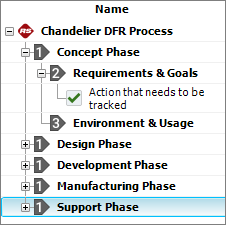
Certain properties of higher-level gates (e.g., status and dates) are determined by the properties of their dependent gates and actions. For example, the "Concept Phase" above has two direct dependents. If these are marked as complete, then "Concept Phase" is automatically marked complete. (See Gates in the Project Plan for details on how gates inherit their properties.)
In this way, the planner makes it easy for you to monitor how the progress of individual activities relates to the completion of the entire process.
Project Planner Columns
To hide or display Project Planner columns, right-click the column headings then click Customize Columns. (You can also change the column order by dragging and dropping column headings into the desired positions.) These settings are stored per computer/username. Any project that you open on this computer will have the same columns displayed, but other users may have different display preferences.
- General columns display graphics/text to summarize the status, as well as the priority level and percent completion.
- Planned Timeline columns display information about the original plan, including planned start/due dates and resource usage. You can also display the percentage of the budget that is allocated to different project planning resources (i.e., teams, facilities and materials).
- Expected Timeline columns display expected start/completion dates given any delays that may have occurred for prior activities, as well as estimates of the costs/man hours to date. (See Project Planner Timelines.)
- Actual Timeline columns display actual start/completion dates, as well as the costs/man hours that were used for completed gates/actions.
- Delta Values columns compare two different values, such as the difference between an action's actual and planned costs.
- Relevant Metrics display values for up to three selected metrics. (See Using Metrics in Project Planner Gates.)
- Notes display other applicable information, including descriptions, completion notes and whether an attached file exists.