Goodness of Fit Results
The Goodness of Fit Results utility performs statistical tests to determine how well the parameters of the distribution fit the data. Note that this utility can only be used to evaluate data sets that do not contain censored data.
To use the utility, first calculate the parameters of the distribution of your data set, and then choose Life Data > Options > Goodness of Fit Results.
![]()
The following picture shows sample results for a particular data set.
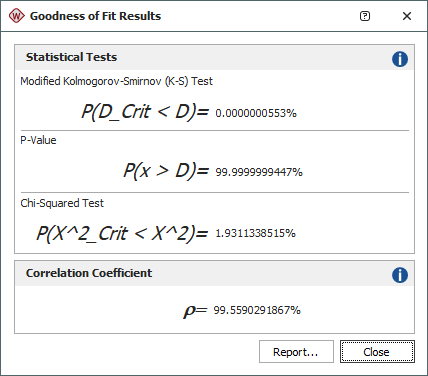
- Both the Modified Kolmogorov-Smirnov (K-S) test and the Chi-Squared test return the probability that the respective critical value (D_Crit for K-S and χ^2_Crit for chi-squared) is less than the calculated statistic value (D statistic for K-S and χ^2 statistic for chi-squared). The calculated statistic value is the difference between the observed probability and the predicted probability. High probability values, close to 1, indicate that there is a significant difference between the theoretical distribution and the data set. In other words, it is an indication that the model may not be a good fit for the data. Note that the chi-squared test may not produce valid results for smaller sample sizes (e.g., minimum of 35).
- The P-Value shows the probability that the calculated statistic value is greater than a random variable. If the p-value is smaller than your specified level of significance, then the model may not be a good fit for the data.
- The Correlation Coefficient test determines how well the plotted points fit a straight line. This test is only available if the parameters were estimated using rank regression. The closer the value of rho (ρ) is to 1, the better the linear fit. A value closer to zero would indicate that the data points are randomly scattered and have no pattern or correlation to the regression line model.