Auto Group Data
The Auto Group Data tool is available for life data folios, life-stress data folios and for reliability growth data folios.
Life Data and Life-Stress Data Folios
The Auto Group Data tool allows you to automatically group together identical data points. This helps to speed up calculations when you have a large data set.
- For life data folios, two data points are considered identical if their failure/suspension times AND the value/text in their Subset IDs columns are identical.
- For life-stress data folios, two data points are considered identical if their failure/suspension times AND stress levels AND the value/text in their Subset IDs columns are identical.
Note: The subset ID can be any text up to 30 characters, including spaces. For example, "A _ _ X" is not the same as "A _ X" where " _" is used to designate a space.
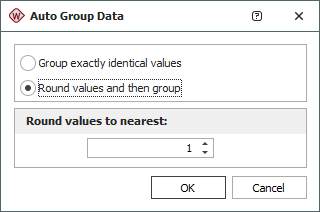
To group your data, click the Auto Group Data icon on the Main page of the control panel.
![]()
You can choose to group exactly identical values, or to first round the failure/suspension times to the nearest whole number or multiple of 10, and then group the identical data.
Reliability Growth Data (RGA) Folios
The Auto Group Data tool is available for data types where the exact failure times have been recorded (i.e., Failure Times and Multi-Phase Failure Times) and for the Fleet data type.
Times-to-Failure and Multi-Phase Data
For the Failure Times and Multi-Phase Failure Times data types, you might use the Auto Group Data tool to smooth out the analysis of a data set that failed the goodness-of-fit test. Grouping the data can also be used to organize the failure times into specified intervals that show the trend in the data rather than the individual failures.
To group data, choose Growth Data > Options > Auto Group Data or click the icon on the Main page of the control panel.
![]()
A new data sheet using the corresponding grouped data type (i.e., either Grouped Failure Times or Multi-Phase Grouped Failure Times) will be added to the same folio and populated with the grouped data.
Fleet Data
For the Fleet data type, the Auto Group Data tool appears automatically when you calculate the data sheet. In this case, the analysis stacks the failure times of each system in the data set into a cumulative timeline, and then converts it to grouped data based on the intervals that you specify. The parameters of the Crow-AMSAA (NHPP) or Crow Extended models are then calculated from the grouped data.
Grouping the Data
The following picture shows the Auto Group Data window. You can choose to specify intervals that are all the same width (constant) or intervals of different widths (user-defined). In both cases, the final interval is defined by the test termination time. The intervals must be representative of the data. The appropriate intervals will depend upon your knowledge and assumptions about the systems under test.
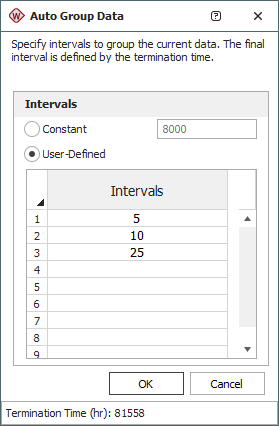
- Select Constant if you want to specify the same width for all intervals. For example, suppose the failure times are 10, 20 and 30 hours, and the test terminates at 40 hours. If you group the data by a constant width of 20 hours, the grouping will show two failures between 0 to 20 hours and one failure between 20 to 40 hours.
- Select User Defined if you want to use intervals of different widths in order to group the data by some qualitative characteristic or other meaningful interpretation of the data. Use the spreadsheet below the option to specify the end time of each interval. The values in the spreadsheet must increase in each subsequent row, but the intervals do not have to be of equal length. For the same example discussed above (failure times at 10, 20 and 30 hours and the test terminates at 40 hours), if you specify the intervals as 5 and 10, the grouping will show no failures between 0 to 5 hours, one failure between 5 to 10 hours and two failures between 10 to 40 hours.