Life Data SimuMatic Example
This example uses the Life Data SimuMatic to compare different parameter estimation methods for a sample of 10 units following a Weibull distribution where beta = 2 and eta = 100, with all units tested to failure.
Generate Data Sets
- Choose Home > Insert > SimuMatic and choose the SimuMatic option.
- On the Main tab of the setup window, select the 2P-Weibull distribution and select Hour (hr) for the time unit. Enter 2 in the Beta field and 100 in the Eta field.
- On the Censoring tab, select No censoring.
- On the Settings tab, enter 1000 in the Number of data sets field and enter 10 in the Number of points field.
- On the Analysis tab:
- Choose Maximum Likelihood (MLE) from the Analysis Method drop-down list. This method will be used to estimate the parameters of the generated data sets.
- Choose Median Ranks from the Rank Method drop-down list and clear the Use RS Regression Method check box. Enter 90 in the Confidence Level field.
- Click Generate to create and analyze the data. A SimuMatic folio will appear.
- Click Plot on
the control panel. You will be taken to the plot sheet of
the folio. In the Show
area of the control panel, make sure the following options
are selected:
- Simulation Lines
- True Parameter Line
- Median Line
- Bounds on Reliability
- Click Plot again to refresh the plot display all the selected lines.
To compare RRX to the rank regression on Y (RRY) and maximum likelihood estimation (MLE) methods, repeat the steps above, but choose a different option in the Analysis Method drop-down list on the Analysis tab. Then compare the three plots.
Compare the Plots
The plots for the three methods are shown below:
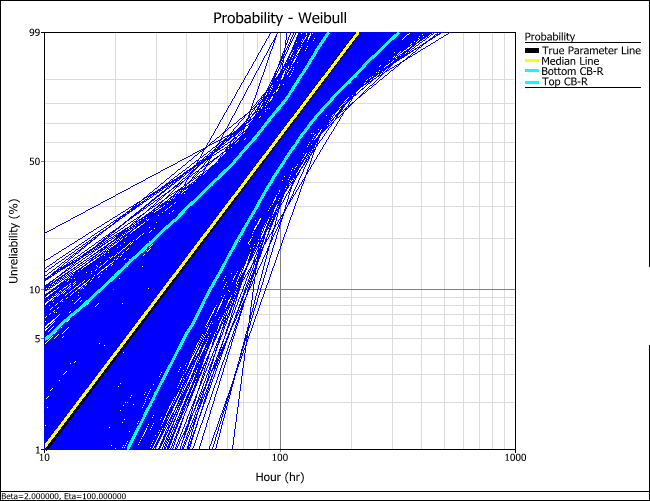
RRX Method
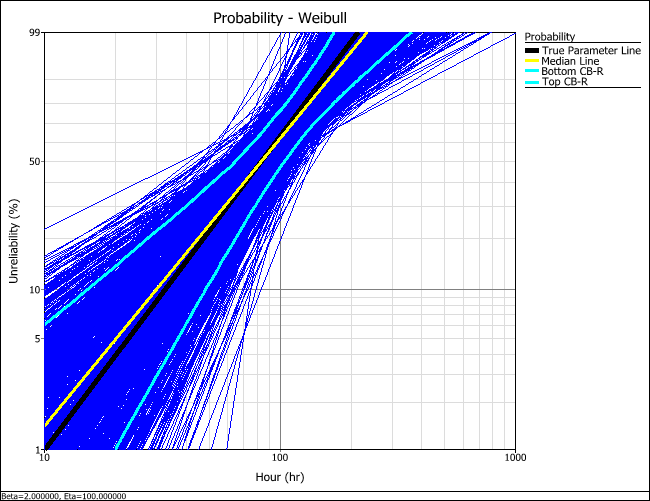
RRY Method
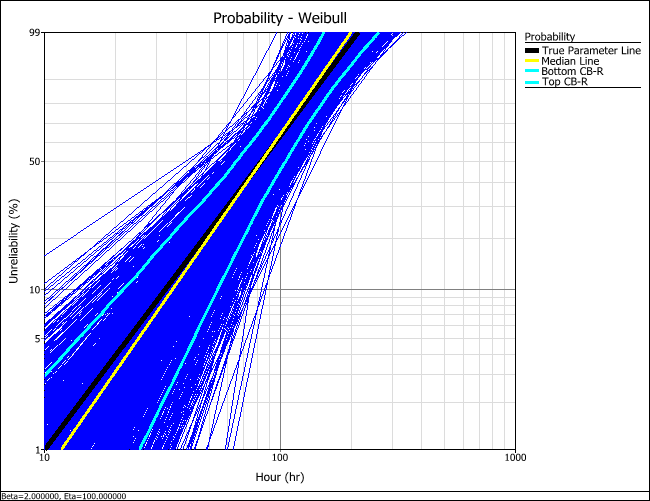
MLE Method
The true parameter line (black) shows the time vs. unreliability defined by the parameters of the distribution that was used to generated the simulated data. The median line (yellow) shows the time vs. unreliability defined by the median parameters of all generated data sets. By comparing these two lines, you can estimate how close the estimated parameters would be to the product's assumed parameters (which you provided in the setup). The plots above show that RRX would provide the least deviation (i.e., "bias") from the truth for this sample size and data type.
The lines marking the lower and upper confidence bounds on reliability (pink) allow you to determine how closely grouped together the parameter estimation results are. The plots above show that MLE would provide results with less variation than any of the other analysis methods for this sample size and data type.
Thus given our relatively small sample size and uncensored data, RRX is shown to be best in terms of bias, while MLE is shown to be best in terms of variation (the median line and true parameter line overlap almost perfectly).