Life Data and Life-Stress Data Monte Carlo Utility
The Monte Carlo utility uses Monte Carlo simulation to generate a single data set containing values that are distributed according to a specified model. The software uses the cdf (cumulative distribution function) of the relevant distribution to solve for time given an unreliability value chosen from a uniform random distribution. The process is repeated with new random unreliability values until the desired number of data points is obtained. The data set is then automatically placed in a life data folio or life-stress data folio, where it can be analyzed like any other data set.
To access the Monte Carlo utility, choose Home > Insert > Monte Carlo. If you have Accelerated Life Testing activated on your computer, you will be offered a choice between the Monte Carlo or Stress-Dependent Monte Carlo utility.
![]()
In general, you can produce a data set in just a few steps:
- Use the Main tab of the setup window to specify the distribution/model and its parameter values.
- Use the Censoring tab of the setup window to specify the censoring type.
- Use the Settings tab of the setup window to specify the number of data points to generate.
- In Accelerated Life Testing, additional steps are required:
- Use the Stress tab of the setup window to specify an appropriate use level and transformation (if applicable) for each stress.
- Use the data sheet on the right side of the setup window to specify the stress levels and the number of data points to generate for each stress level.
To learn more, the following sections provide complete descriptions of all available options in the utility.
Main Tab
The Main tab of the setup window allows you to select a distribution/model, enter its required parameter values and select the time or usage units (e.g., hours) for the failures/suspensions in the data set.
If the estimated values of the distribution parameters are not available, you can use the Quick Parameter Estimator button to solve for them.
For the life data Monte Carlo utility:
- If you select the normal, logistic or generalized gamma distributions, the Allow Negative Values check box will be available. When generating data to simulate a test, negative failure times can be used to simulate failures that occur before a unit's testing period begins, such as failures due to manufacturing defects or damage that is incurred during shipping.
- If you select the mixed Weibull distribution, you will need to specify parameters for each subpopulation. The Portion field is for the percentage entered as a decimal of the total data set represented by the selected subpopulation. Thus, the sum of the portion values for all subpopulations must be equal to 1.
- If you select the User-Defined distribution, you can
manually enter an equation that relates different random variables.
(See User-Defined
Equations.)
- In the Equation area, use R to insert a uniform random variable.
- Click the Insert Data Source button if you wish to generate simulated values based on distributions calculated from a folio in the project.
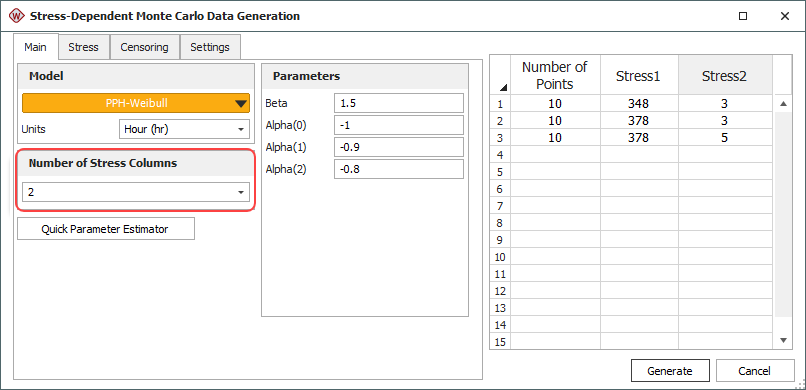
For the Stress-Dependent Monte Carlo utility:
- If you select the proportional hazards (PPH), general
log-linear (GLL) or cumulative damage (CD) model, the Number of Stress Columns
area will be enabled. It allows you to add stress columns
to the data sheet on the right side of the window. In the
data sheet, specify the value of each stress level and how
many data points you want generated for each stress level.
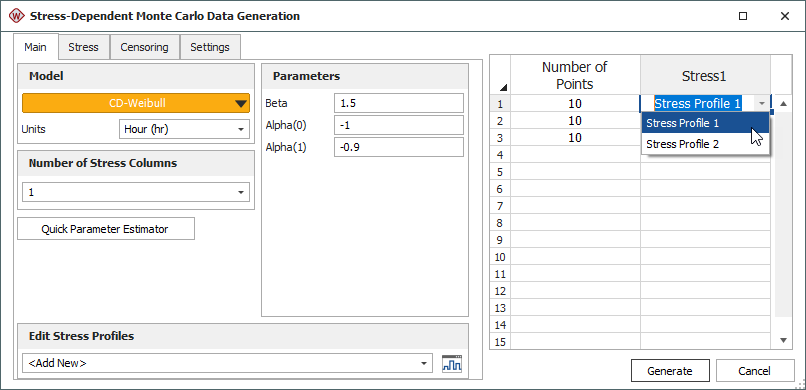
- If you select the cumulative damage (CD) model, you
must assign time-dependent
stress profiles to the stress columns in the data sheet.
To create a new profile, choose <Add New> from the Edit Stress Profiles drop-down list and then click the Create/View Profile icon . To edit an existing profile, choose
it from the drop-down list and then click the icon.
. To edit an existing profile, choose
it from the drop-down list and then click the icon.
Stress Tab (Accelerated Life Testing Only)
The Stress tab of the setup window applies to the Stress-Dependent Monte Carlo utility only. It allows you to specify a use level for each stress type. There will be a separate input box for each stress column in the data sheet.
If you have selected the general log-linear (GLL) or cumulative damage (CD) model, you must also select an appropriate Transformation for each stress:
- None X=V is for stress types associated with the exponential life-stress relationship (LSR). This transformation is commonly used for indicator variables (e.g., 0 = on/off and 1 = continuous operation).
- Reciprocal X=1/V is for stress types associated with the Arrhenius LSR. This transformation is commonly used for thermal stresses.
- Logarithmic X=ln[V] is for stress types associated with the inverse power law LSR. This transformation is commonly used for non-thermal stresses.
Censoring Tab
- No censoring: The generated data set will contain only exact failure times (i.e., it will contain no right censored, interval or left censored data).
- Right censoring after specific number of failures: You specify the number of failures, n, that the generated data set will contain. After the data are generated, they are sorted. The first n data points will be marked as failures while the remaining data points will be marked as suspensions at a time equal to the time of the nth failure. When used with SimuMatic, this option allows you to simulate a failure-terminated test (i.e., a test that ends after a specified number of failures occur).
Note: To illustrate how this censoring is performed in the Stress-Dependent Monte Carlo utility, suppose you chose to generate 20 data points (e.g., 10 at one stress level and 10 at another) and entered 10 in the Number of Failures field. The software would first generate 20 time values. Then the lowest 10 values across all the stress levels would be marked as failure times. The remaining 10 values would be marked as suspensions.
- Right censoring after a specific time: You specify a duration in the Time field. All simulated values that do not exceed this time will be marked as failure times. Values that exceed this time will be considered suspensions at the specified time (i.e., units that had not failed by the end of the test). When used with SimuMatic, this option allows you to simulate a time-terminated test (i.e., a test that ends after a specified time).
- Random censoring (available in for life data only): You provide percentages to specify what proportions of your total data points will consist of right censored, interval and left censored data. The remaining data points will be exact failure times. Thus, the sum of the three percentages entered cannot exceed 100%. This option can be useful for exploring how different kinds of uncertainty in your data can influence the results of an analysis.For example, the settings in following picture shows that the software will generate a set of data points, where 20% of the data are right censored, 20% are interval censored, 20% are left censored and the remaining 40% are complete data (i.e., exact failure times).

Note: With random censoring, the software will censor your data using a uniform distribution. If this option is used to generate multiple data sets in SimuMatic, the percentages you enter will apply to the total number of generated data points, not the number of data points within each data set. Thus, if you select to have 50% of your generated data consist of suspensions (right censored data), half of all your data points will be suspensions, though some data sets may still contain more suspensions than others.
Settings Tab
The Settings tab of the setup window allows you to specify how you want to generate the data set and where you want the data to be stored:
- Use Seed allows you to set a consistent starting point from which the random numbers will be generated. Using the same seed value and keeping all other settings the same will allow you to replicate your results.
- Math Precision allows you to specify the number of decimal places to use for each simulated data point.
- Data Points
sets the number of data points you wish to generate.
- For the life data Monte Carlo utility, use the Number of points field.
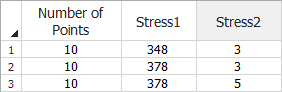
- For the Stress-Dependent Monte Carlo utility, use the data sheet on the right side of the window. For example, if you have selected a multi-stress model, the following settings would generate 10 data points for Stress 1 = 348 and Stress 2 = 3, 10 data points for Stress 1 = 378 and Stress 2 = 3, and 10 data points for Stress 1 = 378 and Stress 2 = 5.
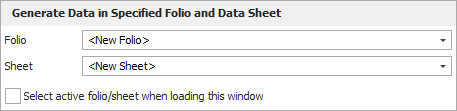
- Generate Data in Specified Folio and Data Sheet allows you to choose where to put the simulated data. Click the Active button to select the folio and data sheet that were active when the utility was opened. If you want the utility to always select the active folio and data sheet, select the Select active folio/sheet when loading this window check box.