Example of a Times-to-Failure Warranty Analysis
A manufacturer sold two versions of a product. In addition, they plan to sell more of the product in the next few months. The objective is to analyze the data for both product versions and provide a return forecast for the next 10 months.
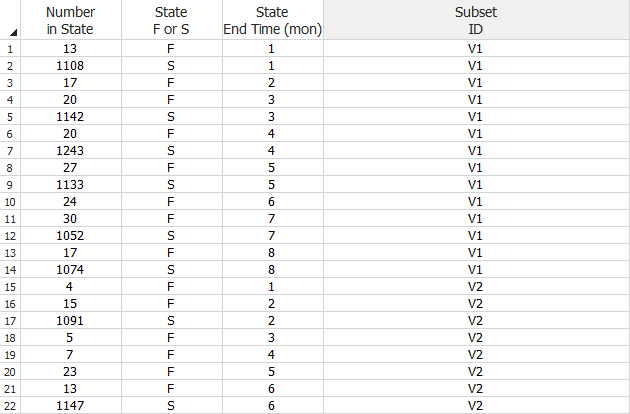
The following data sheet shows the data for the product. The return period (State End Time) is measured in months. The manufacturer logs the number of failures and suspensions for each product version at the end of each month.
In the Future Sales data sheet, they enter the number of units they plan to ship to stores in the next 9th and 10th months, as shown next.

Analyze the Data for Each Product Version
- On the Main page of the control panel, select the Use Subsets option. Then
for each subset ID, choose the 2P-Weibull
distribution and the MLE
analysis method. Click Calculate.
- The parameters for V1 are estimated to be: beta = 2.3819 and eta = 25.3976.
- The parameters for V2 are estimated to be: beta = 2.3207 and eta = 21.2829.
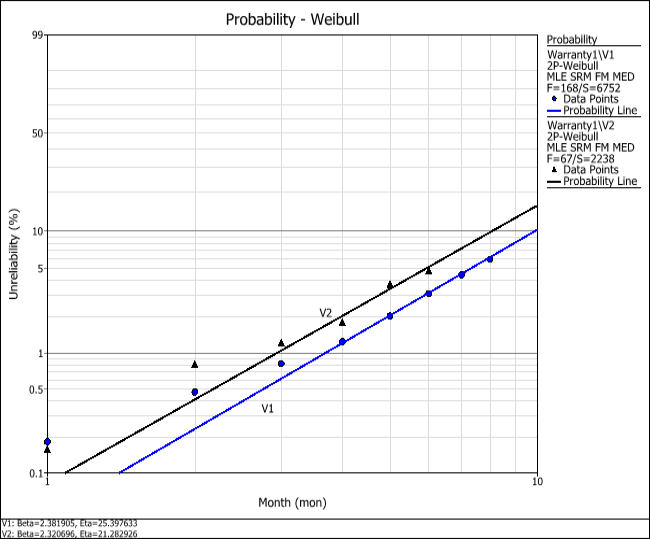
- On the control panel, click the Plot icon. The following plot shows the probability of failure of the two product versions. It shows that V2 has a higher probability of failure compared to V1.
Generate a Warranty Forecast
The next step is to generate a warranty forecast to predict the expected number of product returns.
- Return to the data sheet and choose Warranty > Tools > Forecast or click the icon on the control panel.
![]()
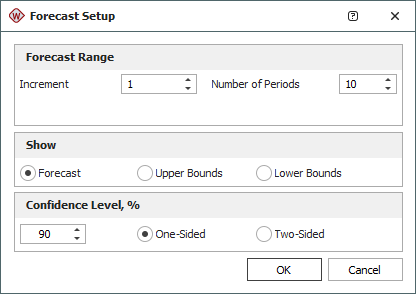
- In the Forecast Setup window, set the increment to 1 and set the forecast length to 10 periods, as shown next. Click OK.
- On the control panel of the Forecast sheet, select the Show Subset ID check box. The following figure shows the results (showing only the first 8 columns).
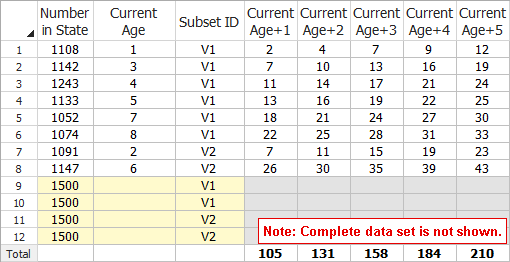
The intervals in the warranty period are indicated by the Current Age plus the increment that was specified in the Forecast Setup window. In the sheet shown above, the first row in the data sheet tells us that 1108 (Number in State) units were operating in the field when the warranty period started and that these unit will have survived at least 1 month (Current Age) of operation. In the 2nd month of operation (Current Age+1), 2 units from that batch are expected to fail. After 4 months of operation (Current Age+3), 7 more units from the batch are expected to fail, and so on. Note that the last 4 rows of the Forecast sheet will show the expected number of returns from the future sales. (In this example, the returns are expected to start at Current Age+10.)
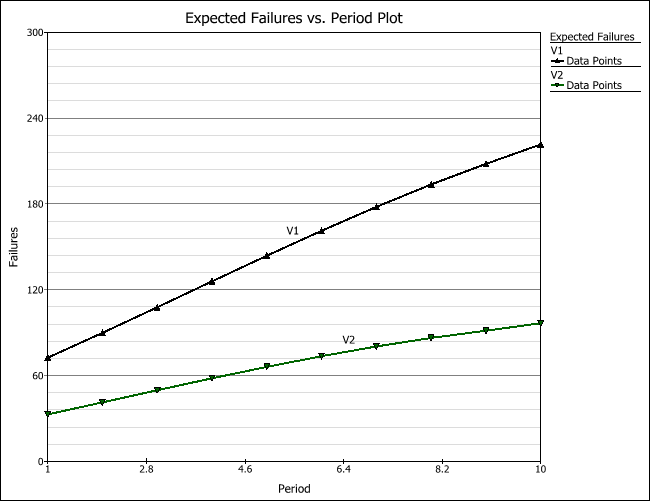
- Click the Plot icon on the control panel of the Forecast sheet. In the Plot Type drop-down field, choose Expected Failures. The following plot shows the trend in the expected number of failures over the next 10 periods. This forecast analysis can help the manufacturer predict the failure behavior of each product version in the field, as well as plan for the warranty costs and service for each product version.
