RDW Dashboards
This topic describes how to use the Dashboard utility for exploring and presenting data from the Reliability Data Warehouse. If an SEP web portal has been implemented for an enterprise database, users can also access RDW dashboards from any web-enabled device.
For static data collections, a variety of dashboard layouts can be predefined. For custom connections, there can be only one layout for each connection.
- Choose Home > ReliaSoft > Reliability Data Warehouse.
![]()
- Double-click the static data collection or custom connection that contains, or links to, the data you want to view in the dashboard.
- On the Build Data Set tab, select which rows to include or exclude. (See Building the Data Set.)
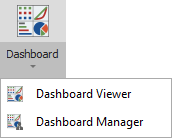
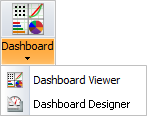
- If an appropriate dashboard layout has already been predefined, switch to the Dashboard Viewer tab or choose Dashboard > Dashboard Viewer. If multiple layouts are available, use the drop-down list at the top of the viewer to choose what to display.
- If you need to create a new layout, choose Dashboard > Dashboard Manager (for a static data collection) or Dashboard Designer (for a custom connection).
(In a secure database, the Dashboard Layout Manager and the Dashboard Layout Designer are available only for users with the "Manage dashboard layouts" permission.)
For information on the data fields available for use in dashboard layouts for RDW data collections, see Data Fields for XFRACAS Data Collections.
Tip: For dashboards that are intended to be viewed in both desktop applications and the SEP web portal, it is recommended to use the Local Colors option on the Design tab of the Dashboard Layout Designer to save your preferred colors with the layout. The global colors definition may not be the same in both web and desktop.