Plot Wizard
In the word processing module for ReliaSoft Workbooks in Weibull++ and BlockSim, you can use the Plot Wizard to generate a variety of plots based on a referenced analysis. These are the same types of plots that are generated in folio or diagram plot sheets. Although you also have the option to copy/paste a static plot graphic from any folio or diagram plot sheet into the report, using the Plot Wizard makes it easy to change the associated data source when you reuse the template and ensures that the plot in the generated report will always show the latest analysis. (For DOE design folios, you can use the DOE Analysis Reports feature to insert plots from a design, multiple linear regression or one-way ANOVA folio, or any of the measurement systems analysis folios.)
To open the Plot Wizard, choose Home > Report > Plot Wizard.
![]()
The following picture shows the plot wizard in Weibull++. Similar functionality is available for BlockSim.

There are three steps to use this tool:
- Select the plot type (and enter the inputs, if applicable)
- Select the data source
- Insert the plot holder
Select the Plot Type
First, select one of the available plot types from the panel on the left side. The right side of the wizard displays some information about the plot that is currently selected.
If applicable, this area also allows you to make relevant inputs (e.g., for life-stress plots that require you to select a specific stress column).
Select the Data Source
To specify the data source that the plot will be based on, choose a number from the Data Source Index drop-down list, as shown next. Using the index makes it easy to reuse the same template with a variety of different data sets.

Insert the Plot Holder
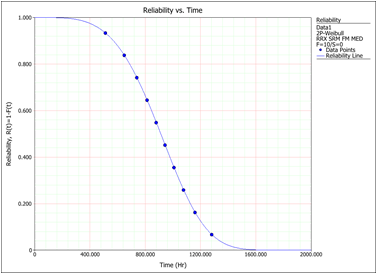
When the plot is fully defined, click Insert to place it at the current cursor location. You can move and/or resize the plot holder after it has been inserted. The plot holder shown next will return the reliability vs. time plot for whatever data source is currently second in the list of associated data sources.

Plot holders will not return any results until you view it in the Review tab or generate the report (Home > Report > Send to Word).