Mission Profiles
For reliability growth data analysis only.
Mission Profiles can help you to ensure that your testing is representative of the expected conditions of actual use by checking, at defined "convergence" points, whether expected usage and actual usage are acceptably close. The ReliaWiki resource portal provides more information about operational mission profile testing at: http://www.reliawiki.org/index.php/Operational_Mission_Profile_Testing.
To add a mission profile folio to a project, choose Home > Insert > Mission Profile or right-click the Mission Profile folder in the current project explorer and choose Add Mission Profile.
![]()
To use a mission profile folio in Weibull++, do the following:
- Set the convergence points
- Define the profile for each separate characteristic that will be tested
- Validate the mission profiles
- Create a plot that allows you to visually compare the actual vs. expected usage in any or all of the defined profiles
If desired, you can also link a profile with a data sheet in order to group the data.
Convergence Points Sheet
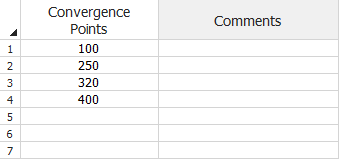
On the Convergence Points sheet, enter the times at which you want to check that the expected usage and the actual usage either meet their expected averages or fall within an accepted range (i.e., the amount that the usage can vary from the expected value, while still being acceptable. For example, if the expected number of miles traveled is 1,000 and the allowed variance is 100, then usages of 1,051 and 913 are acceptable, while usages of 1,103 and 879 are not). You must include a minimum of three convergence points in the analysis. The test times between the convergence points do not have to be the same.
The following example shows a convergence points sheet with four times defined.
All of the defined convergence points must be included in all of the profile sheets that you add to the folio. To automatically add the defined convergence points to each profile sheet, choose Mission Profile > Mission Profile > Transfer Convergence Points to Profile Sheets or click the icon on the control panel.
![]()
Profile Sheet
Each profile sheet represents a different part of testing (e.g., a different task that the system performs, etc.). By default, each new mission profile folio starts with one profile sheet. You can add additional profile sheets to the folio by choosing Mission Profile > Mission Profile > Insert Profile Sheet.
![]()
At a minimum, each profile sheet must contain the times that you entered on the convergence points sheet. It may also contain any additional times at which usage is observed and recorded.
The profile sheet contains the following information:
- The Cumulative Time column indicates the time at which the usage is measured. The input is cumulative, which means that the times must be increasing and each row represents the total test time up to that point.
- The Expected Usage column is the usage value that you expect at that time (e.g., the distance that the system should have traveled, the number of hours it should have operated or the number of times it should have performed a certain action). These inputs are also cumulative, which means that the values must be increasing and each row represents the total distance, hours operated, times used, etc. up to that point in time.
- The Actual Usage column is the usage value recording during the testing. These inputs are also cumulative.
- In the Plus/Minus Range field, specify the accepted variance from the expected usage values.
The following example shows part of the data in a profile sheet.

Validating the Mission Profile
After you have entered all of the data, you can validate the profile to make sure that all necessary data points have been entered. To do so, choose Mission Profile > Mission Profile > Validate Mission Profiles or click the icon on the control panel.
![]()
This feature checks that all convergence points are in all the profile sheets and sorts the data by the Cumulative Time column.
Note: Validation also occurs when you generate a plot of the mission profile. If all of the data points have been entered, all of the profile sheets are marked as being verified.