Fielded Data
For reliability growth data analysis only.
The fielded data types are used for analyzing data from repairable systems operating in the field under typical customer usage conditions. Such data might be obtained from a warranty system, repair depot, operational testing, etc.
Although fielded systems analysis applies some of the same statistical models that are used to analyze data from developmental testing, it should be noted that there is a difference in the underlying analysis assumptions. For developmental testing data, the analysis assumes that permanent fixes are being applied to improve the inherent reliability of the design; whereas for fielded system data the analysis assumes that systems may fail and be repaired many times, and that each system will always be "as bad as old" after a repair (i.e., the concept of minimal repair). The fielded systems analysis assumes that permanent design improvements, if any, are delayed until a later time.
Tip: If you assume that each repair partially renews the system (i.e., "better than old but worse than new") or restores the system to "as good as new," then the General Renewal Process (GRP) may be a more appropriate model. This model is available using a Parametric RDA folio.
There is a choice of two data sheets for analyzing data from fielded systems. In general:
-
Use the Repairable data type for analyzing the individual failure times for multiple repairable systems operating in the field. The analysis models the number of individual system failures vs. system time.
-
Use the Fleet data type for analyzing the failure times for multiple repairable systems from a fleet (rather than individual system) perspective. The analysis groups the data and models the number of fleet failures vs. fleet time.
These data sheets can be used for two kinds of analysis. In general:
- If you wish to perform repairable systems analysis based on the assumption of minimal repair (i.e., the system is "as bad as old" after each repair), use the Power Law model in a Repairable data sheet. If the power law model does not provide a good fit, you can transfer the data to a Fleet data sheet and use the Crow-AMSAA (NHPP) instead.
- If you wish to estimate the jump in reliability that can be expected from rolling out the same set of permanent design fixes to all systems in the field, use the Crow Extended model.
- In a Repairable data sheet, the Crow Extended analysis method is intended to be used specifically for "Operational Testing" situations when there is careful control of the test conditions and the failure intensity observed in the field is constant (i.e., beta = 1). Only two of the three failure mode classifications are applicable for such scenarios (A = no fix or BD = delayed fix).
- In a Fleet data sheet, the Crow Extended analysis method does not require the assumption that the failure intensity observed in the field is constant (i.e., beta does not have to equal 1). All three of the failure mode classifications are available (A = no fix, BC = fixed during test and BD = delayed fix).
Note: Weibull++ displays a warning in the growth data folio when the beta = 1 hypothesis is invalid (i.e., when the 90% two-sided confidence bounds on beta do not include 1). You can choose whether to display this warning by using the Beta = 1 hypothesis is Invalid option on the RGA Growth Data Folios page of the Application Setup.]
When you select the Crow Extended model, the Classification and Mode columns will be inserted into the data sheet. (See Failure Mode Classifications.) When this model is applied to a Repairable data sheet, the analysis assumes that all permanent design fixes are delayed until a later time and therefore only two of the three failure mode classifications are available: A = no fix and BD = delayed fix.
By default, all data sheets include a Comments column for logging any pertinent information about each row of data. You can add a second comments column or delete the columns by choosing Growth Data > Format and View > [Insert Columns/Delete Columns] > Comments. The information in these columns does not affect the calculations in the folio.
(See Minimum Data Requirements for Fielded Data.)
Repairable Systems
The Repairable data type is used for analyzing the individual failure times for multiple repairable systems operating in the field. It models the number of individual system failures vs. the system time.
You can enter the data in the Normal View or Advanced Systems View. The following example shows the Normal View. The System ID column is for recording the ID of the system. The Event column specifies whether the row represents the start time (S), failure time (F) or end time (E) of the system. The Time to Event column is for recording the total operating time when the specified event occurred.
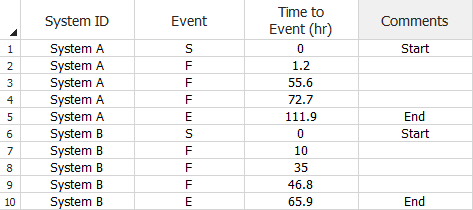
Repairable Systems Data Sheet (Normal View) for Fielded Systems
Analysis
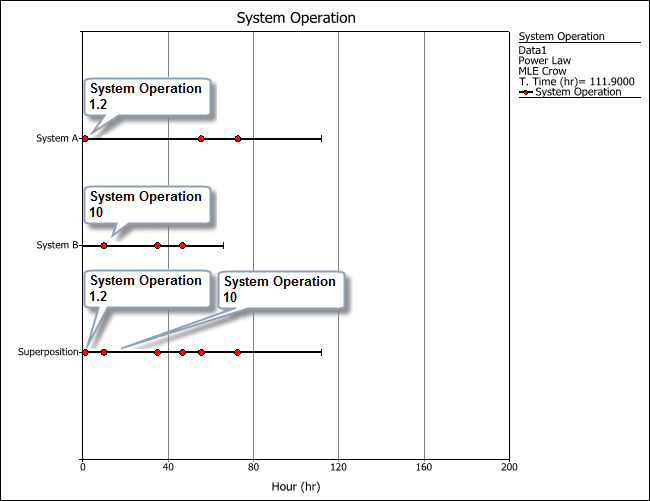
In repairable systems analysis, Weibull++ places the failure times of the systems on a single timeline to create a superposition system, which shows the order in which all the failures in the data set occurred. For example, the following plot shows the failure times of both systems in the example, along with the timeline for their superposition system. The timeline shows that the first failure occurred at 1.2 hours (System A) and that the second failure occurred at 10 hours (System B). The termination time in the superposition system is equal to the age of the oldest system.
The parameters of the superposition system, along with the results of the goodness-of-fit tests for that system, are calculated automatically when you analyze the data sheet. Any plots and QCP results will be also based on the superposition system.
Fleet
The Fleet data type is used for analyzing the failure times for multiple repairable systems from a fleet (rather than individual system) perspective. It groups the data and models the number of fleet failures vs. the total operating times of all systems in the fleet.
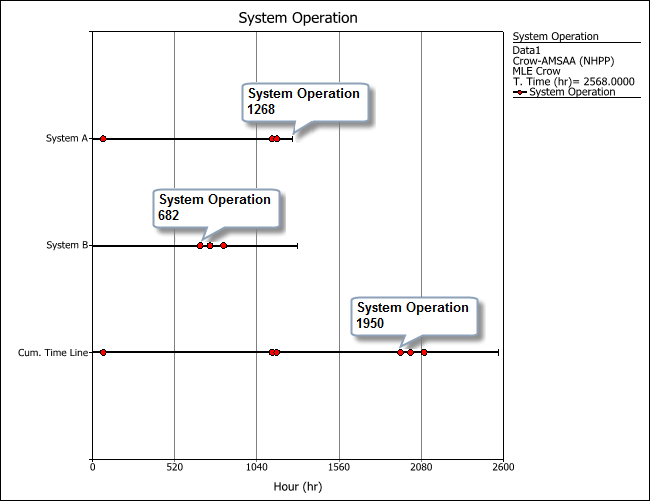
Data entry in the Fleet data sheet is the same as described above for the Repairable Systems data sheet. However, in fleet data analysis, the failure times of each system are stacked into a cumulative timeline. This allows Weibull++ to model the failures in the population over the cumulative fleet operating time. The termination time in the cumulative timeline is equal to the sum of the ages of all the systems in the analysis. For example, the following plot shows that System A operated for a total of 1,268 hours. The first failure of System B (at 682 hours) is added to System A's end time to obtain a failure time of 1,950 hours for the cumulative timeline.
As the example demonstrates, the data sets of all the systems are stacked one after another based on the order in which the systems were entered into the data sheet; if we had entered the data set of System B first, then the first failure time of System A would have been added to the end time of System B. The ReliaWiki resource portal has more information about how the order of the systems may affect the fleet analysis at http://www.reliawiki.org/index.php/Fleet_Data_Analysis.
Tip: For any given observation period, the Fleet data sheet requires a complete record of the failure times of all the systems in the fleet. If your data set is limited to a record of the total amount of operating time for the fleet per observation interval (where the intervals may be measured in weeks, months, etc.) and the total number of system failures in those intervals, then you can use the Grouped Failure Times data type instead.