Transfer Data to Life Data Folio
For life-stress data only.
You can transfer data in a life-stress data folio to a life data folio in order to perform life data analysis on your accelerated test data.
To transfer the data, click the Transfer Data to Life Data Folio icon on the control panel.
![]()
Then select how you want to transfer the data:
- Transfer all data to a single data sheet copies the values from the stress columns to the subset ID column of the new life data folio data sheet. In multiple-stress situations, a stress level is a combination of stress values. (If desired, you can later use the Batch Auto Run tool to extract data subsets from the data sheet.)
- Transfer use level data creates a free-form data sheet within the new life data folio and copies the probability of failure over time values (Y-Axis Values) at the specified use stress levels (X-Axis values) into it.
- Transfer data for each
stress to a separate data sheet groups the accelerated
data set according to stress level and then places each group
into its own data sheet in the new Weibull++ life data folio.
In multiple-stress situations, a stress level is a combination
of stress values. There are two additional options:
- Calculate parameters after transfer automatically calculates each data sheet using the life distribution from your selected model.
- Add contour plot creates a contour plot that compares the calculated parameters for each data sheet, allowing you to determine, for example, whether the shape parameter estimates for the data obtained at different stress levels differ significantly at a specified confidence level. (This option is not available for free-form data.)
- Create and transfer a stress distribution data set calculates the product's unreliability at the specified time and at different stress intervals. The stress intervals will range from the use stress level to the maximum stress level used in the test, with equal increments in between. This information will then be exported to a free-form data sheet in a new life data folio. In multi-stress situations, you can click the Select Stress to Vary icon to select which stress type will be varied in the software's unreliability calculations. The remaining stress types will be fixed at their specified use stress values.

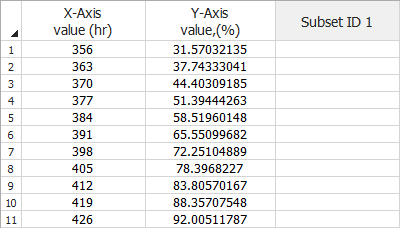
In the free-form data sheet, the X-axis represents the stress intervals and the Y-axis represents the unreliability (as a percentage ) for each interval, as shown in the following example. The product's use stress level is 356 K, and the maximum stress level used in the test is 426 K. Thus, the X-axis values range from 356 to 426. If the specified time was 1,000 hours, then, according to the first row of this data sheet, the product has a probability of failure of 31.57% at 1,000 hours at a stress level of 356 K. If you wish, you can calculate this data to further analyze the relationship between stress level and unreliability.
