Example: Discrete (Success/Failure) Data
For reliability growth data analysis only.
The data set used in this example is available in the example database installed with the software (called "Weibull22_ReliabilityGrowth_Examples.rsgz22"). To access this database file, choose File > Help, click Open Examples Folder, then browse for the file in the Weibull sub-folder.
The name of the project is "Discrete Data- Sequential."
A cartridge device is required to have a reliability of 95% at the end of a reliability growth testing program. The device is designed for emergency use and its casing is destroyed when it releases its charge; therefore, the design can be tested and improved only through sequential pass/fail tests. The result of each trial (whether the device passed or failed) is recorded in a Discrete Sequential data sheet.
Choose the Logistic model, and then analyze the data set by choosing Growth Data > Analysis > Calculate or by clicking the icon on the Main page of the control panel.
![]()
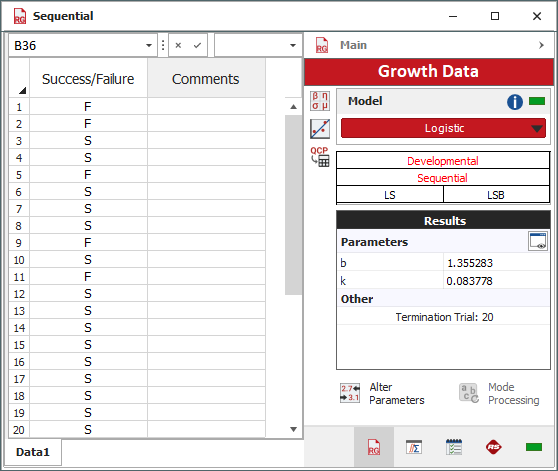
The following picture shows the data set and the calculated parameters of the logistic model.

To create a plot of the results, choose Growth Data > Analysis > Plot or click the icon on the Main page of the control panel.
![]()
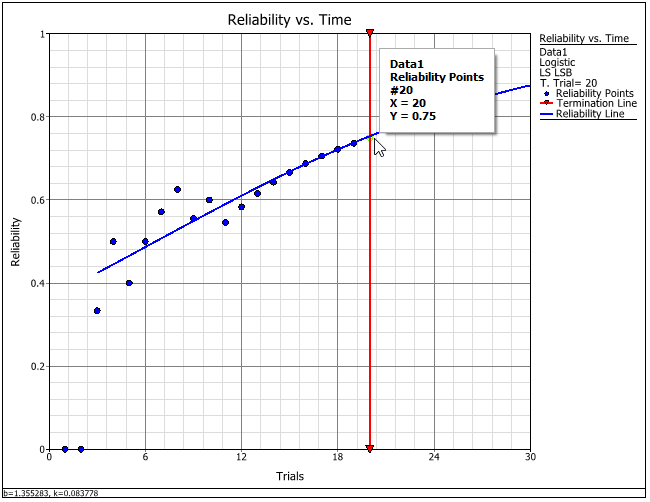
The following reliability vs. time plot shows how the reliability of the device changes with each new improvement in the design. The vertical line represents the stage when the test was terminated. This plot shows that the reliability after 20 trials is 75%.

You can use the Quick Calculation Pad (QCP) to predict when the reliability will reach 95%. To access the QCP, choose Growth Data > Analysis > Quick Calculation Pad or click the icon on the Main page of the control panel.
![]()
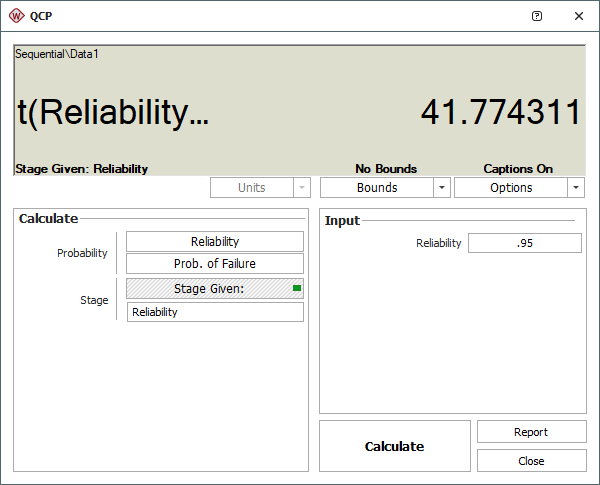
In the QCP, select to calculate the Stage Given Reliability, and then enter 0.95. Select Hour for the time units and click Calculate to obtain the result. The result indicates that if the reliability keeps its trend, it is expected to reach 95% at the 42nd stage of testing, as shown next.
