Optimal Design Example
The data set used in this example is available in the example database installed with the software (called "Weibull22_DOE_Examples.rsgz22"). To access this database file, choose File > Help, click Open Examples Folder, then browse for the file in the Weibull sub-folder.
The name of the example project is "Optimal Custom Design."
In this example, a full factorial design is created that requires 24 unique factor combinations. Then, the Optimal Design utility is used to optimize the experiment so only 15 factor combinations are required. Finally, the optimized design is evaluated and modified to meet the experimenter’s goals.
An experimenter wants to conduct some tests to study the effects of 4 factors. The main effects and the interaction effects AB, BC and CD will be investigated. The factors and factor levels that will be used in the experiment are shown next.
|
Factor |
Level 1 |
Level 2 |
Level 3 |
|
A: Material Type |
M1 |
M2 |
M3 |
|
B: Curing |
Curing |
No Curing |
- |
|
C: Temperature |
120°C |
150°C |
- |
|
D: Pressure |
4 bars |
5 bars |
- |
If a full factorial design is used, the number of required factor combinations is 24. However, due to the constraints of the test facility, only 15 unique factor combinations can be used. Moreover, because of safety concerns, the combination A = M2, B = Curing, C = 150°C and D = 5 bars cannot be used.
Based on the above information, the experimenters need to choose 15 runs from the 24 unique runs in the general full factorial design. The resulting design will then be evaluated and further modified if necessary.
Creating a Preliminary Design
To begin, the experimenter creates a preliminary full factorial design. This will serve as a starting point for the optimal design. The design matrix is given in the "Preliminary Design" folio. The following steps describe how to create this folio on your own.
- Choose Home > Insert > Standard Design to add a standard design folio to the current project.
![]()
- Click Design Type in the folio's navigation panel, and then select General Full Factorial in the input panel.

- Specify the number of factors by clicking the Factors heading in the navigation panel and choosing 4 from the Number of Factors drop-down list.
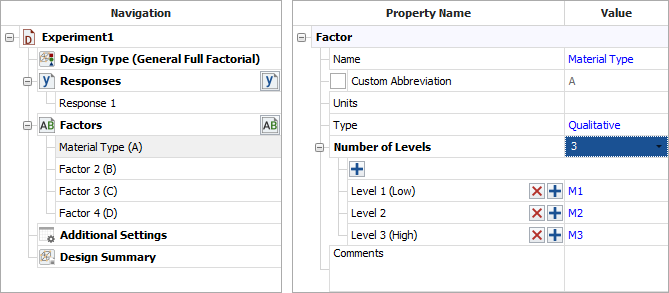
- Define each factor by clicking it in the navigation panel and editing its properties in the input panel. The properties are given in the table above. The first factor is defined as shown next. (Note that the third and fourth factors are quantitative.)
- Rename the folio by clicking the Experiment1 heading in the navigation panel and entering Preliminary Design for the Name in the input panel.
- Next, click the Build icon on the control panel to create a Data tab that allows you to view the preliminary plan.
![]()
- Finally, sort the test runs in the preliminary design
using the standard, non-randomized order. Sorting the test
runs in this way will make it easier to find the factor level
combination that you will later exclude from the design.
- Choose Data > Format and View > Visible Columns and select to view the Standard Order column in the Visible Columns window.
- Click a cell in the Standard Order column, and then choose Sheet > Sheet Actions > Sort > Sort Ascending.
Optimizing the Design
The preliminary design requires 24 factor combinations. To optimize the design so it only requires 15 unique factor combinations, view the experiment plan on the Data tab of the "Preliminary Design" folio. Then choose Data > Design > Optimal Design.
![]()
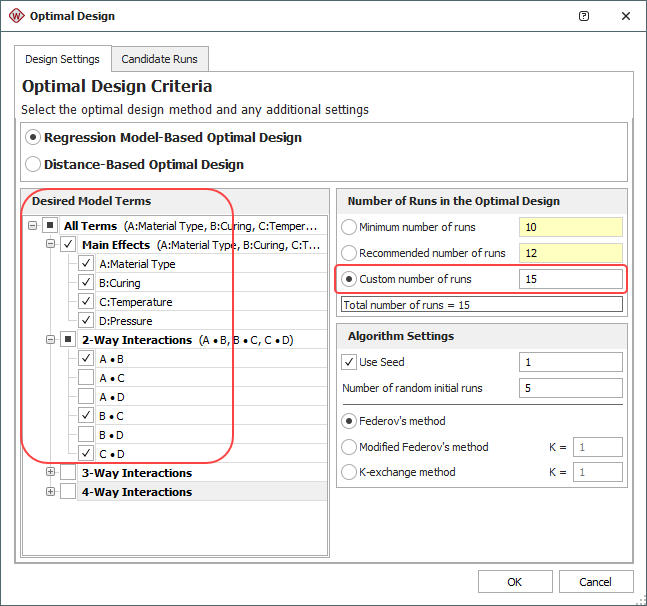
On the Design Settings tab of the window that appears, specify the terms that you are interested in investigating in the Desired Model Terms area. Also, in the Number of Runs in the Optimal Design area, specify how many runs you want to include in the design.
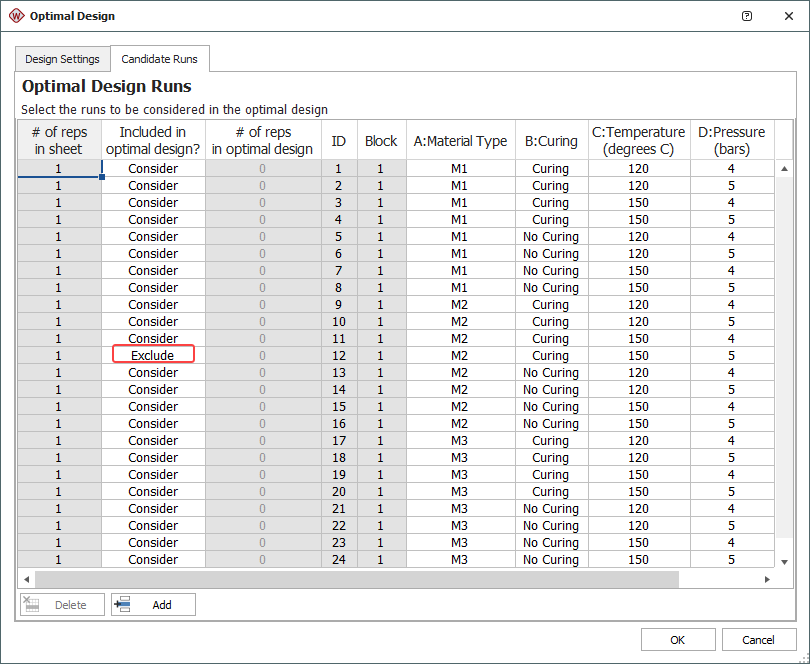
On the Candidate Runs tab, make sure the unsafe factor level combination (A = M2, B = Curing, C = 150°C and D = 5 bars) is not used by selecting Exclude in the second column for that combination.
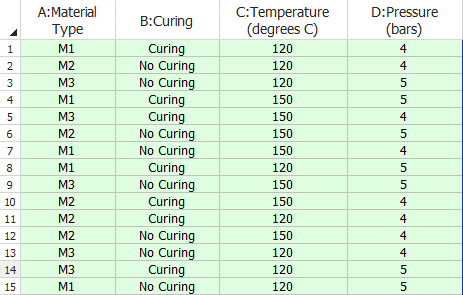
After you click OK, the resulting optimized design is given in the "Optimal Design" folio, as shown next. (Since the standard order is no longer relevant, you can open the Visible Columns window again to hide that column.)
Note: To minimize the effect of unknown nuisance factors, the run order is randomly generated whenever you create a design. Therefore, if you followed these steps to create your own folio, the order of runs in your folio may be different from that of the folio in the example file. This will not affect the design evaluation results described next.
Evaluating the Design
The experimenter wants to evaluate the power of the design (i.e., the probability that it will detect an active effect). The settings for the evaluation are specified on the Evaluation Settings page of the Data tab control panel.
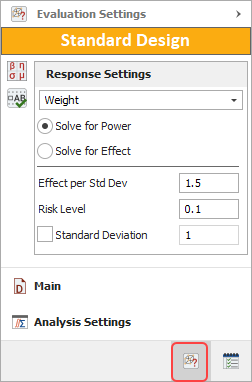
Click the Calculate icon to return to the Main page of the control panel. A summary of the evaluation results will be shown in the Design Evaluation area. Click the Detailed Results link in that area to view the calculated power values for each term that was included in the evaluation.
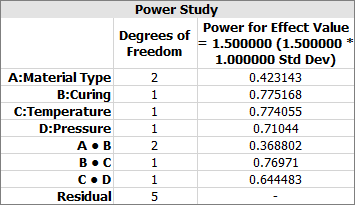
The power values for effect A and interaction AB are relatively small, which means the experiment is not likely to detect these effects if they are active. To increase the power, more runs need to be added to the experiment.
Augmenting the Design
Two more replicates are added to the optimal design using the Augment Design tool. To use this tool, view the experiment on the Data tab and then choose Data > Design > Augment Design.
![]()
In the window that appears, specify that 2 replicates will be added and click OK.
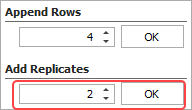
The new design is given in the "Optimal Design - Replicates" folio.
The power values for this design are:
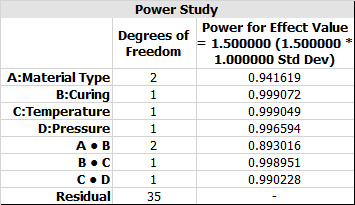
The experimenter considers these values high enough. Therefore, this design is used as the final one.