Plot Settings
The Plot page of Weibull++'s Application Setup contains default settings that will be applied when you create a new plot sheet. Note that some of the configurable settings that are saved with the plot can still be modified from the control panel and others can be modified via the Show/Hide Plot Items window (Plot > Actions > Show/Hide Plot Items).
- Settings for Plot Sheets
- Enable auto refresh activates the auto refresh option.
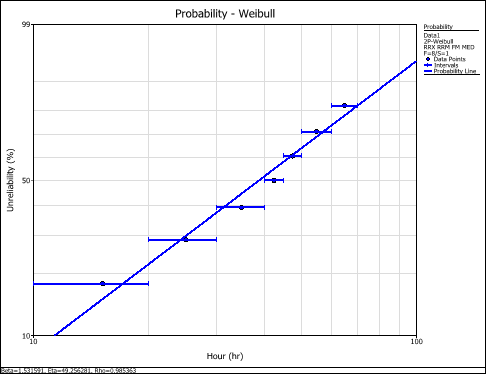
- Show lines around interval points shows lines around the points for interval censored data. The lines represent the starting and ending time for each interval. For example:
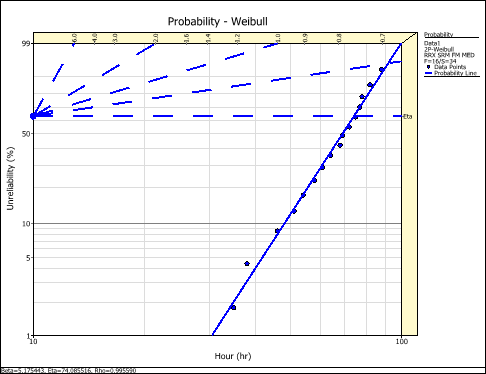
- Show parameter scales shows the parameter scales on a probability plot. The probability scales allow you to read the parameters directly from the plot.
- Show parameter bars places a box around the parameter scales on a probability plot. For example:
- Show left censored points displays the left censored points as triangles on the bottom of the plot when plotting interval or left censored data.
- Show suspensions displays the suspension (right-censored) data points as triangles on the bottom of the plot when plotting suspended data.
- Other Options
- Enable interactive plot highlights and shows the coordinates/values of a point, line, slice or bar on the plot when you move the mouse pointer over it. Note that if you change this setting, you must redraw the plot to see the change.
- Adjust MLE points on plot line. For MLE plots, it adjusts the y-axis positions of the plotted points to fit the MLE solution line (instead of plotting the points from rank regression).
- Straighten Gamma line straightens the parameter line on the probability plot for data sheets that use the gamma or generalized gamma distributions. Note that if you change this setting, you must redraw an affected plot to see the change.
- Display interval lines (when applicable) applies only to Reliability Growth times-to-failure data sheets. Select the check box to display the instantaneous interval lines on the MTBF vs. time plot or failure intensity vs. time plot.