Distribution Wizard
The Distribution Wizard performs multiple goodness of fit tests to determine the best distribution for a data set based on the chosen parameter estimation method. Note that the Distribution Wizard only serves as a guide. You should compare its suggestion with your own engineering knowledge about the product being modeled before making the final decision on which distribution to use for your data set.
Comparing Distributions
To use the Distribution Wizard, you must have at least two failure data points in the current data sheet.
The first step is to choose a parameter estimation method from the control panel. Then open the Distribution Wizard by choosing Life Data > Analysis > Distribution Wizard or by clicking the icon on the Main page of the control panel.
![]()
On the Main tab of the Distribution Wizard, select the distributions you would like to consider. (The available distributions will vary depending on which folio you opened the tool from.) Then click Analyze to start the evaluation. The distributions will be ranked according to how well they fit the data, with rank 1 being the best fit.
In the example shown next, the 3P-Weibull distribution is the suggested distribution for the data set. The parameter estimation method selected in the data sheet (in this case, MLE) is displayed at the bottom of the window.
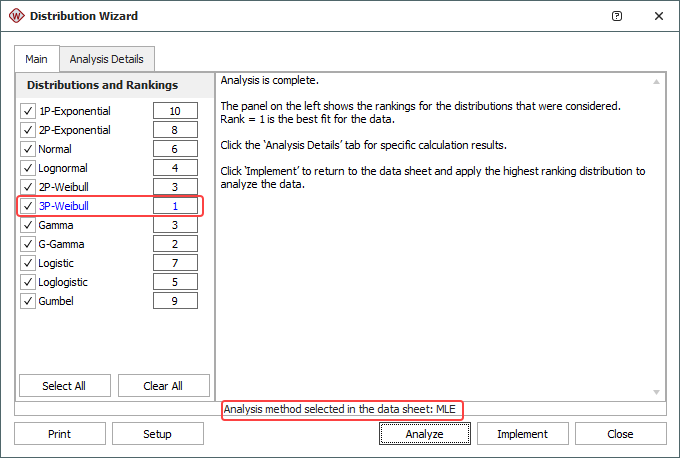
To calculate the parameters of the distribution in the rank 1 position, click the Implement button. This closes the Distribution Wizard, and the results will appear in the Analysis Summary area of the control panel.
Note: You may find that the Distribution Wizard often recommends either the 3-parameter Weibull distribution or the generalized gamma (G-Gamma) distribution. This is because these distributions have the ability to mimic the attributes of other distributions based on the values of the distribution's parameters. In such cases, if you have reason to believe that the recommended distribution is not applicable, you may prefer to select the distribution with the next highest ranking.
Goodness of Fit Tests
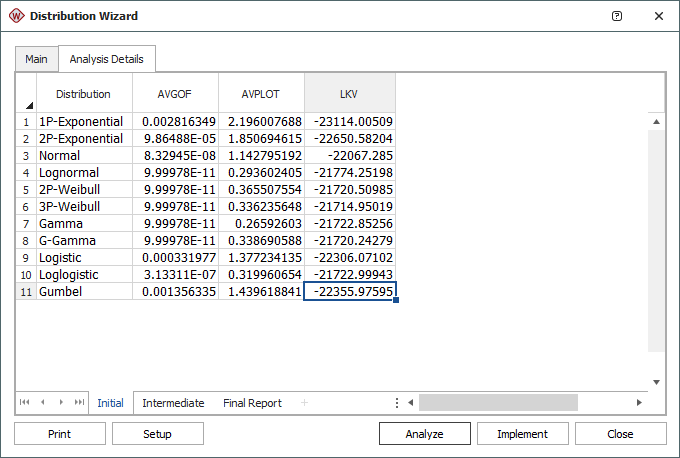
To see the calculations behind the ranking, click the Analysis Details tab. The Distribution Wizard performs three goodness of fit tests to determine the rank of the distributions:
- The Kolmogorov-Smirnov test (GOF) tests for statistical difference (the difference between the expected and obtained results).
- The Correlation coefficient test (PLOT) measures how well the plotted points fit a straight line.
- The Likelihood value test (LKV) computes the value of the log-likelihood function, given the parameters of the distribution.
The Initial sheet contains the values computed from the three tests. The AVGOF column contains the average values from the GOF test, the AVPLOT column contains the average values from the PLOT test and the LKV column contains the average values from the LKV test, as shown next.
The Intermediate sheet displays the ranking of the distributions based on the values from the Initial sheet. The RAVGOF column contains the ranking of the GOF test, the RAVPLOT column contains the ranking of the PLOT test and the RLKV column contains the ranking of the LKV test.
The values from the Initial sheet are first weighted (e.g., AVGOF * weight) and then summed into one overall DESV value (i.e., weighted decision variable). The distribution with the lowest DESV value is considered to be the best fit for the data. The weights assigned to each test are based on the parameter estimation method. For example, by default, a higher weight is given to the LKV test if the parameter estimation is MLE; whereas in rank regression, higher weights are given to the K-S and Rho tests. The weights can be adjusted in the Setup window of the Distribution Wizard.
The Final Report sheet displays all the distributions in their final ranking order and the calculated parameters for each distribution.
Distribution Wizard Setup Window
When you open the Distribution wizard from the Weibull++ life data folio, you have the option to change the weights that are used to determine the ranking of the distributions. Click the Setup button at the lower right corner of the Distribution Wizard to view the settings, as shown next.
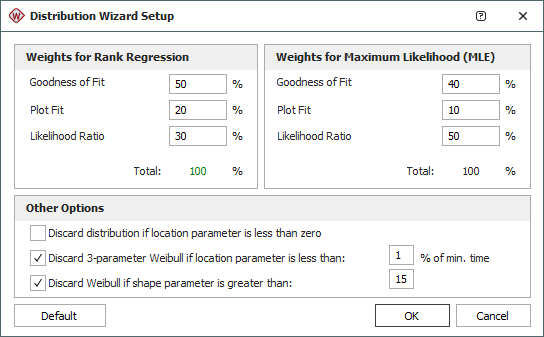
You can use different weights for the rank regression method and the MLE method. The sum of the three weights for each parameter estimation method must equal 100%. The weights are:
- Goodness of Fit represents the weight percentage for the GOF test.
- Plot Fit represents the weight percentage for the PLOT test.
- Likelihood Ratio represents the weight percentage for the LKV test.
The settings in the Other Options area specifically affect the Weibull and exponential distributions:
- Discard if location parameter is less than zero will exclude the Weibull and exponential distributions from the ranking if their location parameters are negative. A negative location parameter indicates that failures occurred before time = 0, or before a product operated for the first time.
- Discard 3-parameter Weibull if location parameter is less than (_)% of min. time will exclude the Weibull distribution from the ranking if the value of the location parameter is smaller than the first time-to-failure. The default setting is for a value that is less than 1% of the first time-to-failure, which is a value close to zero.
- Discard Weibull if shape parameter is greater than (_) will exclude the Weibull distribution from the ranking if the shape (beta) parameter is greater than a specified value. The default setting is to discard the distribution if the beta value is greater than 15.