Using Robust Parameter Designs
The Data tab for robust parameter designs works differently from that for other design types.
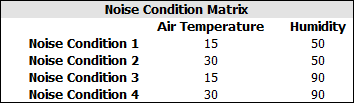
In each cell in the noise condition columns, enter the response value obtained at the control factor settings specified in the current row and at the current noise condition. The noise factor settings represented by each noise condition column are available in the Noise Condition Matrix in the Design Summary on the Design tab. For example, consider the Noise Condition Matrix and Data tab shown next.
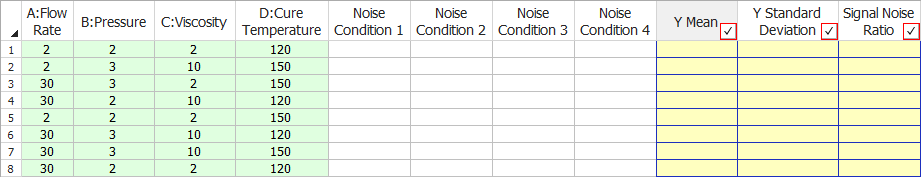
In the first row of the Data tab, you would enter the response values that were measured with the control factors set as follows:
- Flow Rate: 2
- Pressure: 2
- Viscosity: 2
- Cure Temperature: 120
In the Noise Condition 1 column, you would enter the value measured at those control factor settings when Air Temperature = 15 and Humidity = 50. In the Noise Condition 2 column, you would enter the value measured when Air Temperature = 30 and Humidity = 50, and so on.
In analyzing the data set, the software can calculate results for the Y Mean, Y Standard Deviation and Signal Noise Ratio columns. You will select one or more of these columns to be used as the "responses" for the analysis by selecting the check boxes in the column headings.
- Each value in the Y Mean column is the average measured response at the specified combination of control factor settings, across all noise conditions.
- The Y Standard Deviation column provides the standard deviation of the response at the given control settings across all noise conditions. This column has the natural log transformation applied by default
- The values in the Signal Noise Ratio column indicate how robust the response is to the noise factors at the specified combination of control factor settings, where a greater value indicates that the measured response is less affected by the noise factors. This is the main point of robust parameter design, so you will almost always have this column selected.
For each column selected for inclusion in the analysis, you can specify settings on the Analysis Settings page of the control panel. For the Signal Noise Ratio column, you must specify the equation to be used in calculating the ratio. Your selection for this option is determined by the purpose of your analysis:
- Nominal (or "nominal-the-best") should be used if you have a specific target value for the measured response.
- Larger (or "larger-the-better") should be used if you want to maximize the value of the measured response.
- Smaller (or "smaller-the-better") should be used if you want to minimize the value of the measured response.