Overlay Plots
Available in Weibull++ and BlockSim, overlay plots give you the ability to display results from multiple analyses in a single plot. This allows you to easily compare different data sets, analysis methods or distributions. For example, you may wish to show the reliability plots of two product designs in the same plot or compare a simulation-based data set with actual data obtained from fielded products.
Creating an Overlay Plot
Before using an overlay plot, you must first analyze the data sets (or simulate the diagrams) you wish to include in the plot. Then to add an overlay plot to the project, choose Home > Insert > Overlay Plot.
![]()
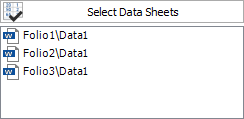
In the window that appears, select the data sheets/diagrams you want to include in the plot (up to a maximum of 20) and click OK to create the plot sheet. The plot sheet will be saved automatically under the Multiplots heading in the current project explorer.
Tip: In Weibull++, you can add additional plot sheets to a folio by choosing [Life Data/Life-Stress Data/Growth Data] > Folio Sheets > Insert Additional Plot. The additional sheets can function as overlay plots to display results from multiple data sheets in the current folio on a single plot.
Adding or Removing Analyses
To add or remove analyses from an overlay plot, click the button on the control panel, as shown in the example below for data sheets.
If you later delete an analysis that is referenced by the plot, the plot will remain available and will continue to show the results of the analysis until you redraw the plot (by clicking the Redraw Plot icon on the control panel).
Note that importing or exporting an overlay plot will automatically import/export the associated source analyses. (See Importing/Exporting Project Items or Resources.)
Available Plot Types for Overlay Plots
The available plots depend on the analysis or type of data you are working with.