One-Way ANOVA Control Panel
The one-way ANOVA folio control panel allows you to control the settings for analyzing response data and displays the results of the analysis. This topic focuses on the Main page and Analysis page of the one-way ANOVA folio control panel, which contains most of the tools you will need to perform the analysis. For more information about the control panel in general, see Control Panels.
Control Panel Main Page
- The Settings area is used to view the settings and status of the analysis.
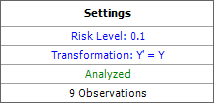
In this example:
- The specified risk level is 10%. To configure this setting, click the text. The Analysis Settings page of the control panel will be displayed, allowing you to set the risk level.
- No transformation is used (i.e., the "transformed" response, Y', is equal to the non-transformed response, Y). To configure this setting, you can click the text or the Select Transformation icon in the folio tools.
- "Analyzed" is shown in green, which indicates that the response data has been analyzed using the current settings. Otherwise, this would show "Modified" in red.
- The last row indicates that the analyzed data consists of 9 observations.
- The Analysis Summary area is shown when the current response data has been analyzed using the current settings. This area displays the p value for the factor and a statement regarding whether or not the factor levels affect the response. Click the View Analysis Summary icon in this area to view the details of the analysis results.
Folio Tools
The folio tools are arranged on the left side of the control panel. Use these tools to configure your analysis and experiment with the analysis results. Depending on the type of design you are working with, the control panel may contain some or all of the following tools:
![]() Calculate analyzes the data for each response
that is selected to be included in the analysis. To exclude a
response from the analysis, clear the check box in its column
heading.
Calculate analyzes the data for each response
that is selected to be included in the analysis. To exclude a
response from the analysis, clear the check box in its column
heading.
![]() Plot creates a plot based on the analysis.
If you click this icon before the current data set has been analyzed,
an analysis will be performed automatically.
Plot creates a plot based on the analysis.
If you click this icon before the current data set has been analyzed,
an analysis will be performed automatically.
![]() Design - View Analysis Summary
opens a window
that contains detailed information about current and past analysis
results.
Design - View Analysis Summary
opens a window
that contains detailed information about current and past analysis
results.
![]() Select Transformation opens a
window that allows
you to select a transformation to apply to each response.
Select Transformation opens a
window that allows
you to select a transformation to apply to each response.
Control Panel Analysis Settings Page
The Analysis Settings page of the one-way ANOVA folio control panel allows you to set the Risk Level, or alpha value. This is a measure of the risk that the analysis results are incorrect (i.e., alpha = 1 - confidence level).