Multi-Phase Plot Control Panel
For reliability growth data analysis only.
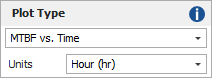
In the Multi-Phase Plot window’s control panel, the Plot Type drop-down list allows you to select whether the plot will display the mean time between failures (MTBF) or failure intensity, while the Units drop-down list allows you to select the units, which are defined at the database level.
The Multi-Phase Plot Setup button opens the Multi-Phase Plot Wizard, which allows you to view or change the data source(s) that are displayed in the plot.
The Show area at the bottom of the control panel allows you to select which results and other elements will be shown in the plot.
- The options under the Phases
and Analysis Points
headings are based on the test data from each phase.
- The Demonstrated values reflect the reliability before any delayed fixes are implemented.
- The Projected values reflect the expected jump in reliability after delayed fixes are implemented.
- The Growth Potential values are the maximum system reliability that can be attained with the current system design and reliability growth management strategy (i.e., all B failure modes have been found and fixed).
- The Estimated Parameters Line is applicable only for the test phases (not analysis points). It shows MTBF or failure intensity vs. time within each individual test phase.
- The Phase Termination Line is applicable only for the test phases (not analysis points). It provides a long vertical line to more clearly mark the end of each test phase.
- The options under the Planning
heading are based on the growth planning folio that’s been
linked to the plot, if any, and on the planning model used
with the planning folio.
These options are available if the planning folio uses the Crow Extended model.- The Nominal Idealized and Actual Idealized lines (also called idealized growth curves) show the overall characteristic pattern for the reliability growth across all phases of testing. The nominal MTBF/FI is the best case scenario, which assumes that the average fix delay is zero. The actual MTBF/FI takes into account the average fix delay.
- The Planned Growth lines mark the time when each phase will begin and end, while the vertical position of each line shows the expected MTBF or failure intensity at the beginning of the phase.
- The Goal Value line shows the target MTBF or failure intensity that you hope to achieve by the last phase of testing.
These options are available if the planning folio uses the MIL-HDBK 189 model.
- The Idealized Growth Curve line shows the overall characteristic pattern for the reliability growth across all phases.
- If the test phase settings are specified, the Average per Test Phase line shows the calculated MTBF at each phase.
If you want to hide/display confidence bounds, choose Plot > Confidence Bounds > [Show/Hide] Confidence Bounds.
![]()
![]()
The remaining options in the control panel are similar to other plot sheets throughout the application. Specifically:
The folio tools are arranged on the left side of the control panel.
![]() Redraw Plot updates
the plot to reflect any changes that have been made.
Redraw Plot updates
the plot to reflect any changes that have been made.
![]() Plot Setup opens
the Plot Setup window, which allows
you to customize most aspects of the plot including the titles,
colors, sizes, etc.
Plot Setup opens
the Plot Setup window, which allows
you to customize most aspects of the plot including the titles,
colors, sizes, etc.
![]() RS Draw launches
ReliaSoft Draw, which allows
you to view the plot in greater detail, add annotations and modify
selected plot elements.
RS Draw launches
ReliaSoft Draw, which allows
you to view the plot in greater detail, add annotations and modify
selected plot elements.
![]() Export Plot Graphic
saves the plot as a graphic in one of the following formats: *.wmf,
*.png, *.gif or *.jpg. You will be able to use the exported graphic
in any application, provided that the application supports the
file format.
Export Plot Graphic
saves the plot as a graphic in one of the following formats: *.wmf,
*.png, *.gif or *.jpg. You will be able to use the exported graphic
in any application, provided that the application supports the
file format.
The Options area provides:
- Auto Refresh automatically updates the plot to reflect any changes that have been made. If not selected, you must click the Redraw Plot icon to refresh the display.
- Keep Aspect Ratio maintains the ratio of the horizontal size to the vertical size of the plot graphic when you resize the plot sheet.
In the Scaling area:
- The X and Y Scaling boxes show the minimum and maximum values for the x- and y-axes. You can change these values if the check box beside the value range is not selected. If it is selected, the application will automatically choose appropriate values for the range.