Mission Profile Plots
For reliability growth data analysis only.
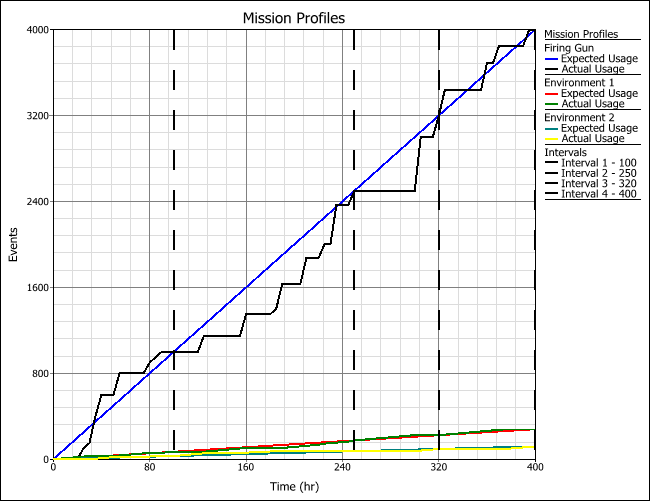
You can visually compare the expected usage and the actual usage in any or all of the mission profiles defined in the folio by choosing Mission Profile > Mission Profile > Plot Mission Profiles or clicking the icon on the control panel. A plot sheet will be added to the folio.
![]()
An example of a mission profile plot is shown next:
The plot sheet control panel includes the following options:
![]() Redraw Plot
updates the plot to reflect any changes that have been made.
Redraw Plot
updates the plot to reflect any changes that have been made.
![]() Plot Setup
opens the Plot Setup window, which
allows you to customize most aspects of the plot including the
titles, colors, sizes, etc.
Plot Setup
opens the Plot Setup window, which
allows you to customize most aspects of the plot including the
titles, colors, sizes, etc.
![]() RS Draw launches
ReliaSoft Draw, which allows
you to view the plot in greater detail, add annotations and modify
selected plot elements.
RS Draw launches
ReliaSoft Draw, which allows
you to view the plot in greater detail, add annotations and modify
selected plot elements.
![]() Export Graphic
allows you to save the current plot graphic in one of the following
formats: *.jpg, *.gif, *.png or *.wmf.
Export Graphic
allows you to save the current plot graphic in one of the following
formats: *.jpg, *.gif, *.png or *.wmf.
- Auto Refresh automatically redraws the plot when something changes. If not selected, you must click the Redraw Plot icon to refresh the display.
- Keep Aspect Ratio maintains the ratio of the horizontal size to the vertical size of the plot graphic when you resize the plot sheet.
- Units allows you to choose which units you want the plot to show from the drop-down menu.
- In the Scaling area, the X and Y Scaling boxes show the minimum and maximum values for the x- and y-axes. You can change these values if the check box beside the value range is not selected. If it is selected, the application will automatically choose appropriate values for the range.
- Show
- Select Show Plus/Minus Range if you want to display lines that show the allowed accepted variance from the expected average usage values on the plot. (Accepted variance is the amount that the usage can vary from the expected value, while still being acceptable. For example, if the expected number of miles traveled is 1,000 and the allowed variance is 100, then usages of 1,051 and 913 are acceptable, while usages of 1,103 and 879 are not.)
- Select Intervals if you want to display the convergence points on the plot.
- Available Profiles allows you to select which of the profile sheets in the folio will be included in the plot.