Gage R&R Folio Control Panel
The gage R&R folio control panel allows you to control the settings for analyzing the measurement system data. It also displays the results of the analysis. This topic focuses on the Main page and Analysis page of the gage R&R folio control panel, which contains most of the tools you will need to perform the analysis. For more information about the control panel in general, see Control Panels.
Control Panel Main Page
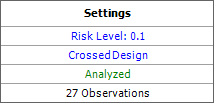
- The Settings area of the control panel displays the settings and status of the analysis. To configure the settings used in the analysis, click the blue text. The risk level and design type settings are accessible on the Analysis Settings page of the control panel.
In this example:
- The specified risk level is 10%.
- A crossed (rather than nested) gage R&R design type will be used. This means each operator will measure the same part multiple times.
- "Analyzed" is shown in green, which indicates that the current response data has been analyzed using the current settings. Otherwise, this would show "Modified" in red.
- The last row indicates that the analyzed data consists of 27 observations.
- The Analysis Summary area is shown when the current measurement data has been analyzed using the current settings. This area breaks down the percentage of measurement variance due to repeatability, reproducibility and the measured part.
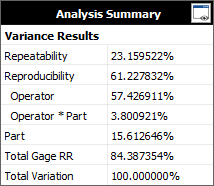
- Repeatability is the variance due to properties of the gage.
- Reproducibility
is the variance due to the operator or the interaction
between the operator and the measured parts. It is the
sum of these variance values.
- Operator is the variance due to the operators' different ways of performing measurements on the same parts.
- Operator * Part is the variance due to the operators' different ways of performing measurements on different parts. To calculate this result, you must go to the Analysis Settings page of the control panel and select to include it in the analysis.
- Part is the variance due to differences in the part being measured (i.e., the part-to-part variance).
- Total Gage R&R is the total of repeatability and reproducibility.
- Total Variation is the total of the part-to-part variance, repeatability and reproducibility.
Click the View Analysis Summary icon in this area to view the details of the analysis results.
Folio Tools
The folio tools are arranged on the left side of the control panel. Use these tools to configure your analysis and experiment with the analysis results.
![]() Calculate analyzes the measurement data and
displays a summary of the results on the control panel.
Calculate analyzes the measurement data and
displays a summary of the results on the control panel.
![]() Plot creates a plot based on the analysis.
If you click this icon before the current data set has been analyzed,
an analysis will be performed automatically.
Plot creates a plot based on the analysis.
If you click this icon before the current data set has been analyzed,
an analysis will be performed automatically.
![]() View Analysis Summary opens a
window that
contains detailed information about current and past analysis
results.
View Analysis Summary opens a
window that
contains detailed information about current and past analysis
results.
Control Panel Analysis Settings Page
The Analysis Settings page of the gage R&R folio control panel includes the following settings.
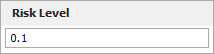
- The Risk Level, or alpha value, is a measure of the risk that the analysis results are incorrect (i.e., alpha = 1 - confidence level).
- The Gage R&R Design Type area allows you to select which type of gage R&R design you will use.
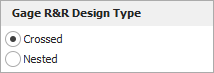
- With the Crossed design type, each operator measures the same part multiple times. For example, if Operator A measures Part 1 twice and Part 2 twice, and Operator B does the same, then the design is crossed. This design type is preferable when individual parts can be measured repeatedly.
- With the Nested design type, each part is measured multiple times by only one operator. For example, if Operator A measures Part 1 twice and Part 2 twice, and Operator B measures Part 3 twice and Part 4 twice, then the design is nested. In this case of destructive testing, this type of design assumes that all the measured parts of the same type (e.g., Part 1) are similar enough to be considered identical.
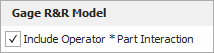
- The Gage R&R Model area allows you select whether the analysis model will include terms that represent the interaction between operators and parts. This option is available for crossed designs only.
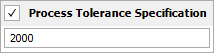
- Process Tolerance Specification area allows you to specify the range of values that are acceptable for the measured product. For example, if the specification for a part is 14.5 ± 0.5 µm, then the process tolerance specification is 1 µm. When this value is provided, the calculation results will include the ratio of measurement variation to the process tolerance.