Gage Agreement Folio Example
The data set used in this example is available in the example database installed with the software (called "Weibull21_DOE_Examples.rsgz21"). To access this database file, choose File > Help, click Open Examples Folder, then browse for the file in the Weibull sub-folder.
The name of the example project is "Gage Agreement Study."
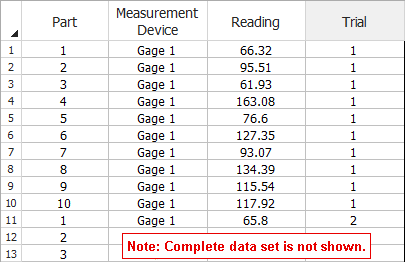
A company needs to investigate if the gages from two different vendors have the same accuracy and precision. Experiments were conducted and the resulting measurements were entered on the Data tab of the example folio. The first 13 rows of data are shown next.

All of the measurements were taken by the same operator (in order to eliminate error due to differences between operators). For example, in the first ten rows, you can see that the operator measured 10 different parts using the same gage. Each measurement is shown in the Reading column.
The Settings area on the control panel shows that a risk level of 10% was used to determine whether a difference in accuracy/precision is considered significant.

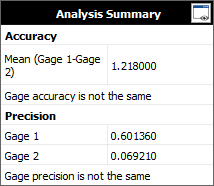
The following summary of the results is also shown on the control panel.

According to these results, the gages differ in both accuracy and precision. To see more results, click the View Analysis Summary icon. The Average Reading Comparison table is used to determine whether the average readings of the gages are different.

As you can see, Gage 1 produced measurements that were, on average, 1.218 units greater than those of Gage 2, but this difference was not found to be significant.
The Regression Study tables are used to determine if there are any differences in accuracy (i.e., linearity + bias) between the gages.

The Simultaneous Coefficient Test is used to evaluate the hypothesis that the gages have the same accuracy. The second row in the Individual Test Table (b1 = 1) specifically tests the hypothesis that the gages have the same linearity. Since the p value of that row is less than the risk level, and since linearity describes how the bias changes with the size of the measured parts, you can conclude that the gages are also different with respect to bias.
Finally, the Precision Comparison table shows how the precision (i.e., repeatability, or variation due to the gage) differs across the gages.

The Repeatability Variance column shows that the gages exhibited different variance in measurements. Since the p value is higher than 1-(risk level/2), or 0.95, it is concluded that the difference in repeatability is significant.
These results shows that Gage 2 is better in terms of repeatability, and that the gages are significantly different with respect to accuracy. Linearity and bias studies should be conducted if you wish to determine which gage is the more accurate one.