Gage Agreement Folio Control Panel
The gage agreement folio control panel allows you to control the settings for analyzing the measurement system data. It also displays the results of the analysis. This topic focuses on the Main page and Analysis page of the gage agreement folio control panel, which contains most of the tools you will need to perform the analysis. For more information about the control panel in general, see Control Panels.
Control Panel Main Page
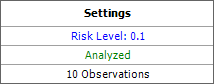
- The Settings area on the control panel is used to view the settings and status of the analysis.
In this example:
- The specified risk level is 10%. This is also known as the alpha value, which is a measure of the risk that the analysis results are incorrect (i.e., alpha = 1 - confidence level). To configure the risk level used in the analysis, click the blue text, which will take you to the Settings page of the control panel.
- "Analyzed" is shown in green, which indicates that the current response data has been analyzed using the current settings. Otherwise, this would show "Modified" in red.
- The last row indicates that the analyzed data consists of 17 observations.
- The Analysis Summary area is shown when the current measurement data has been analyzed using the current settings. This area displays the following values.
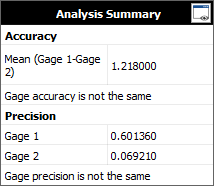
- The Accuracy area displays the difference between the average observation of the first gage and that of the second gage. If the difference is significant according to the paired T-test that is performed on the data, then the accuracy of the gages is not the same.
- The Precision area displays the variance due to repeatability for each gage. If the difference is significant, then the precision of the gages is not the same.
Click the View Analysis Summary icon in this area to view the details of the analysis results.
Folio Tools
The folio tools are arranged on the left side of the control panel. Use these tools to configure your analysis and experiment with the analysis results.
![]() Calculate analyzes the measurement data and
displays a summary of the results on the control panel.
Calculate analyzes the measurement data and
displays a summary of the results on the control panel.
![]() Plot creates a plot based on the analysis.
If you click this icon before the current data set has been analyzed,
an analysis will be performed automatically.
Plot creates a plot based on the analysis.
If you click this icon before the current data set has been analyzed,
an analysis will be performed automatically.
![]() View Analysis Summary opens a
window that
contains detailed information about current and past analysis
results.
View Analysis Summary opens a
window that
contains detailed information about current and past analysis
results.
Control Panel Analysis Settings Page
The Analysis page of the gage agreement folio is used to enter the Risk Level, or alpha value, which is a measure of the risk that the analysis results are incorrect (i.e., alpha = 1 - confidence level).