Effect Plot Calculation Options
For effect plots that show mean response values, the Response drop-down list in the Calculation Options area allows you to specify how the means will be calculated at the different factor levels.
Use the drop-down list in this area to select the type of mean value that is used. Note that, for some effect plots, only fitted means will be available.
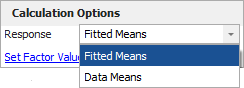
- Fitted Means uses mean values based on the fitted regression model. When you use this option, you can click Set Factor Values to specify how factors will be treated in the calculation.
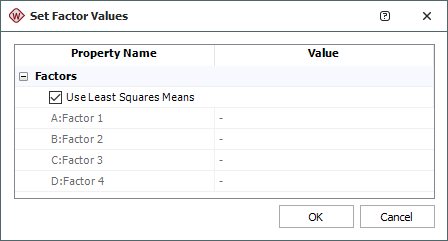
- Select Use Least Squares Means to set all non-varied factors to 0 (i.e., remove them from the response calculation).
- For some plots created in the mixture design folio, you can select Use Centroid to set the plot's reference point to the center of the design for the response trace plot, or to set the values of any non-varied mixture components.
- Clear the option if you want to manually specify the values of non-varied factors.
- Data Means uses the mean values from the observed data entered on the Data tab. (If a transformation has been applied to the response during analysis, data means will be based on the transformed values.)
- When this option is used for response surface method designs, the mean values will not include curvature because only a fitted regression model can account for quadratic effects.