Dashboard Viewer
Any user can access the Dashboard Viewer in a variety of locations throughout ReliaSoft desktop applications for graphical presentation of the latest analysis data.
When dashboard functionality is available for the data you’re working with (e.g., Project Planner, Analysis Explorer, simulation diagrams in BlockSim, etc.), choose Dashboard > Dashboard Viewer to open the viewer.
![]()
Select any of the predefined dashboard layouts from the drop-down list to see the latest charts for the current data set.
Resizing Panels
To resize the dashboard items vertically and/or horizontally,
click between two items and drag the resize cursor ( ) to the height and/or
width you want. This option is available when a dashboard contains
multiple items.
) to the height and/or
width you want. This option is available when a dashboard contains
multiple items.
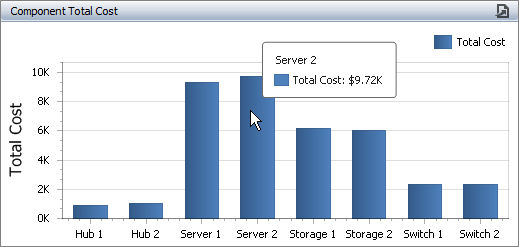
Showing Details in Charts and Pies
To see more details about the underlying data, move the mouse pointer over a bar or slice. For example, when the pointer is over a bar in a chart, the values for the x and y axes will be displayed in the tooltip.
Drill Downs and Master Filters
For information about how to use charts that have been configured for a drill down, see Viewing Drill Downs. For information about how to use charts that have been configured with master filters, see Using Master Filters.
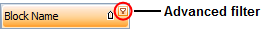
Sorting and Filtering Data in a Grid
- To sort the data in ascending or descending order, click the column heading.
- To filter the data, click the Advanced Filter icon to see a drop-down list of filters that you can apply. The dashboard uses the same advanced filters functionality that is built in to other utilities (e.g., Resource Manager, Analysis Explorer, etc.). (See Finding and Filtering Records.)
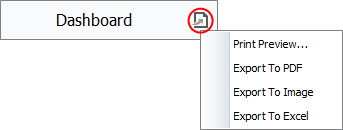
Printing or Exporting the Dashboard
To print the entire dashboard, or export it as a *.pdf file, an image or an Excel file, click the Export To icon.