Analysis Results for Traditional RGA
For reliability growth data analysis only.
When you calculate a data set, the analysis results will be displayed in the Results area on the control panel. The following pictures show some examples of analysis results.
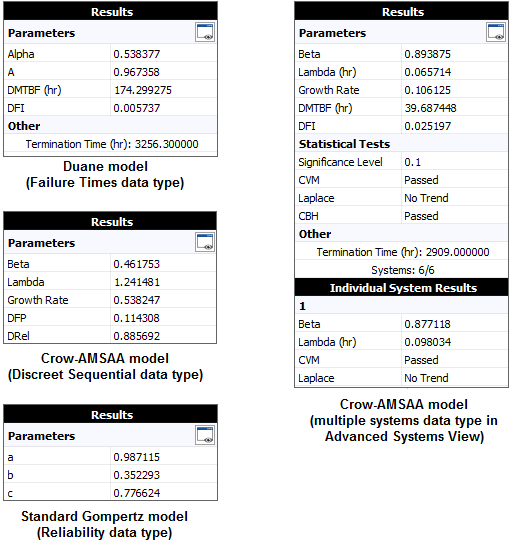
The available results will vary depending on the data type and model you are working with. The results may include the following:
- The estimated parameters of the model are always displayed. For example, this will be a, b and c for Standard Gompertz; A and Alpha for Duane; Beta and Lambda for Crow-AMSAA; etc.
- The estimated Growth Rate. A larger growth rate means faster MTBF growth.
- The instantaneous MTBF and failure intensity at the end of the observation period. An option on the Calculations page of the Application Setup window determines whether you prefer to call these values "demonstrated" (DMTBF and DFI) or "achieved" (AMTBF and AFI) for all new folios. For existing folios, you can change the option in the Settings tab of the Item Properties window (Project > Current Item > Item Properties).
- The demonstrated reliability (DRel) and demonstrated failure probability (DFP), which is 1 - DRel.
- Whether the test was Failure Terminated or has a specified Termination Time for the calculations. (See Termination Time window.)
- Whether the data set passed or failed the applicable goodness-of-fit tests that are performed automatically when you calculate the parameters (applies to the Crow-AMSAA model only). Only the test(s) that apply to the data type you are using will appear in the results. (See Statistical Tests.)
- For data sheets that support the Advanced
Systems View, the following information will also be displayed.
- The number of systems that were included in the analysis (e.g., 4/6 means four out of six systems were analyzed). You can omit a system from the analysis by clearing its check box on the Systems panel while the data sheet is in Advanced Systems View.
- The control panel will show two sets of results: the larger table at the top shows the results for the equivalent system (which represents the combined operating hours of the systems), and the smaller table at the bottom show the results for the individual system that is currently selected in the data sheet. The specific system name is shown in the heading of this table.
Note: If the result of the analysis is associated with a published model, then the model's name will appear as a link at the bottom of the Results area. Click the link to view the model's properties. For details on how to publish the results as a model, see Publishing Models.