Analysis Explorer
The Analysis Explorer is available in all ReliaSoft desktop applications except MPC. You can use this flexible tool to explore all of the different analyses that are stored in the current database.
What's Changed? In versions prior to Version 2020, the Analysis Explorer was called the Synthesis Explorer.
To access the utility, choose Home > ReliaSoft > Analysis Explorer.
![]()
To reduce the amount of time required to populate the grid, first use the project and item filters (discussed below) to limit your search, then click Load Data.
![]()
The analyses shown in the explorer may include:
- Project items in Weibull++, BlockSim and Lambda Predict (e.g., folios, diagrams, plots, ReliaSoft Workbooks, etc.).
- Analyses that are associated with system hierarchy items in XFMEA/RCM++ (e.g., FMEAs, control plans, risk based inspection analyses, etc.).
- Project Plans that can be created for any project.
You can filter/sort/group the analyses based on ReliaSoft application, analysis type, analysis creator and many other properties. You can also present the information in a wide variety of dashboard charts.
This topic summarizes the tools you can use to find and organize data in the Analysis Explorer’s flexible grid. For information about presenting the data graphically, see Analysis Explorer Dashboards. For a list of the properties that can be used in either the grid or the dashboard, see Analysis Explorer Properties.
Save and Apply Views
Once you have customized the Analysis Explorer’s grid to suit a particular purpose (using the built-in find/filter, column configuration and grouping features described below), you can save the preferences as a view that can be used again whenever you need it. A view is saved in the database and available only to the user who created it.
To create a view, first configure the grid to suit your particular needs and then click Save View.
![]()
To quickly apply these same preferences again at any time, click Apply View and select one of the saved views from the list.
![]()
Note: The view does not affect filtering that has been applied from the Project Filter, Item Filter or Category Panel.
Project and Item Filters
The Analysis Explorer can utilize the same project and item filters that are available in many other locations throughout ReliaSoft desktop applications. For example, with the custom filters shown below, the Analysis Explorer will show only analyses performed by Department A (project filter) that were modified within the last month (item filter).

To remove either filter, select Show All from the drop-down list. To remove both filters at the same time, select Clear Filters.
![]()
After you clear or change these filters, you must click Load Data again to update the grid.
![]()
Category Panel
The category panel provides a quick way to filter the data based only on item category. For example, you might use the panel to first view the analyses for Category A and then quickly switch to see the analyses for Category B.
To show or hide the panel, click Show Category Panel.
![]()
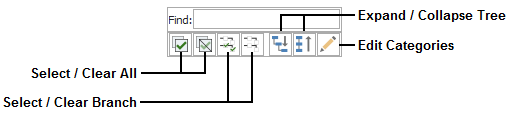
When there are many categories, the tools at the top of the panel can help you find and select the one(s) you need.
Built-in Find/Filter, Configuration and Grouping Tools
The Analysis Explorer offers the same filter, column configuration and grouping tools that are built in to other utilities that use a similar grid (e.g., the Resource Manager). For details about how to use each feature, see: