Using Master Filters
When a dashboard with master filters is created, it can be configured for single or multiple filtering. If you see either of the following, then filtering is enabled:
-
For single filtering, the dashboard title is followed by light gray text.

-
For multiple filtering, the Clear Master Filter icon displays in the caption bar, if the bar is visible.
![]()
Note that if you see both the icon and light gray text, this means that multiple filtering is enabled, but only one item in the filter is selected.
Single Filtering
For single filtering, you can only select one item at a time. You will not be able to clear the view, only select a different item.
Multiple Filtering
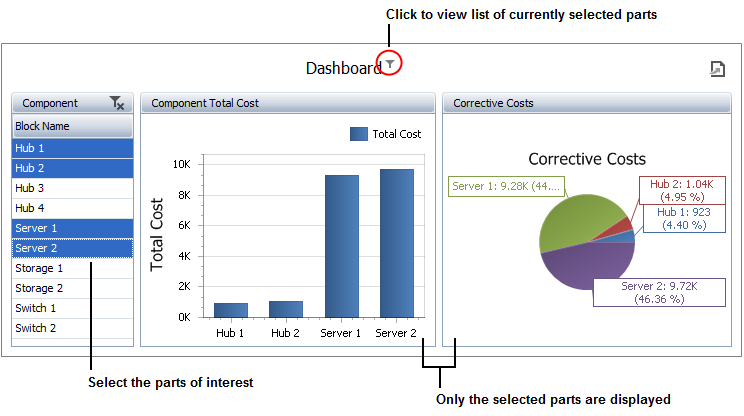
For multiple filtering, you can select as many filter items as you want to view. Hold down SHIFT while clicking to select consecutive elements or hold down CTRL while clicking for nonconsecutive items.
In the example shown next, the grid was set up as the master multiple filter. The chart and pie charts display the data for the four parts selected in the grid.

To reset the view, click the Clear Master Filter icon or right-click, then choose Clear Master Filter.