Setting Target Markers
When applicable, the plot control panel may display a link for Target Reliability, Target Unreliability, Target MTBF/FI or Target Availability. These links give you the option to display markers for target values on the plot.
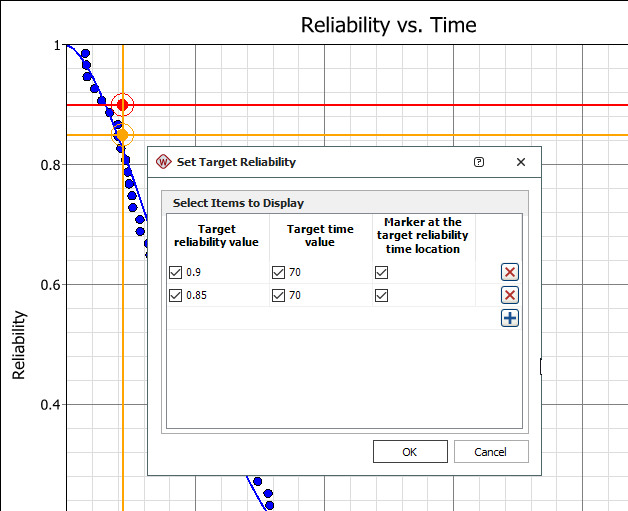
You can select to show a specified target value (displayed as a horizontal line), target time value (displayed as a vertical line), and/or insert a marker at the point where the two target values intersect. Below is an example for a plot that shows the target reliability.
Click the Add ![]() or Remove
or Remove ![]() icon to manage the list of target values to be displayed. You can add up to 5 sets of target values/markers to a plot.
icon to manage the list of target values to be displayed. You can add up to 5 sets of target values/markers to a plot.
