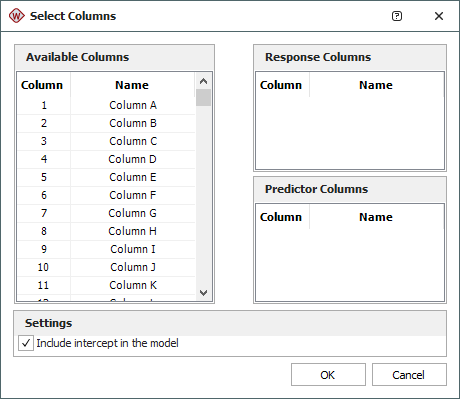
Select Columns Window
The Select Columns window allows you to specify, for each column on the Data tab of the multiple linear regression folio, whether that column contains response data or predictors (e.g., factor levels). It is accessed by clicking the Select Columns icon on the Main page of the Data tab control panel.
![]()
This window will also appear if you try to calculate the data or generate plots without specified response and predictor columns.

The Available Columns area displays the columns on the Data tab that have not been specified as containing either response data or factor settings.
The Response Columns area displays the columns that have been specified as containing response data.
The Predictor Columns area displays the columns that have been specified as containing values for predictor levels.
Select one or more columns in the Available Columns area and then drag them to either of the other two areas. To select multiple columns, click the first one and then press and hold CTRL while you individually select additional columns. You can also press SHIFT to automatically select all the columns in between the first and second column you click.
The Include intercept in the model option includes the intercept in the analysis for all responses, thereby removing any effects that do not vary.
Once you have specified the columns you want to use in the analysis, click OK to apply the changes to the folio.