Plot Setup
The Plot Setup utility provides advanced settings for customizing the look of a plot to meet your needs and preferences. It allows you to: a) make changes and apply them to the current plot; b) save the changes and use them as default settings for all new plots; c) restore previously saved default values; or d) reset all settings to the shipped defaults.
Tip: You can quickly set some basic default settings for all new plots created in the current ReliaSoft desktop application via the Plots page of the Application Setup (File > Application Setup). The Application Setup also allows you to set some default analysis settings that may affect the appearance of plots (varies depending on the ReliaSoft desktop application).
To open the Plot Setup, click the Plot Setup icon on the plot’s control panel.
![]()
Alternatively, you can double-click the item on the plot you wish to edit (e.g., points, lines, etc.) and the Plot Setup will open and display automatically the options associated with that item.
To apply your changes to the current plot, click OK. To save your changes as the new defaults, or restore previously saved defaults, or reset to shipped defaults, click the Defaults button. (See Plot Defaults Window for more information.)
What's Changed? Starting in Version 2019, many plot options that had also been available from the Application Setup window are now available only with the Plot Setup utility.
Importing and Exporting Plot Settings
Starting in Version 2019, you have the option to import and export plot settings to an XML file. This allows you to define the settings for one plot and then use them in other plots.
-
To export the current settings, click Export.
![]()
-
To import settings from an XML file, click Import.
![]()
Plot Elements
The Plot Setup is divided into pages that contain related settings for particular plot elements. The available pages/elements will depend on the type of plot you are working with.
-
Bars (in bar charts)
-
Slices (in pie charts)
-
Plot items (e.g., points, lines, etc.)
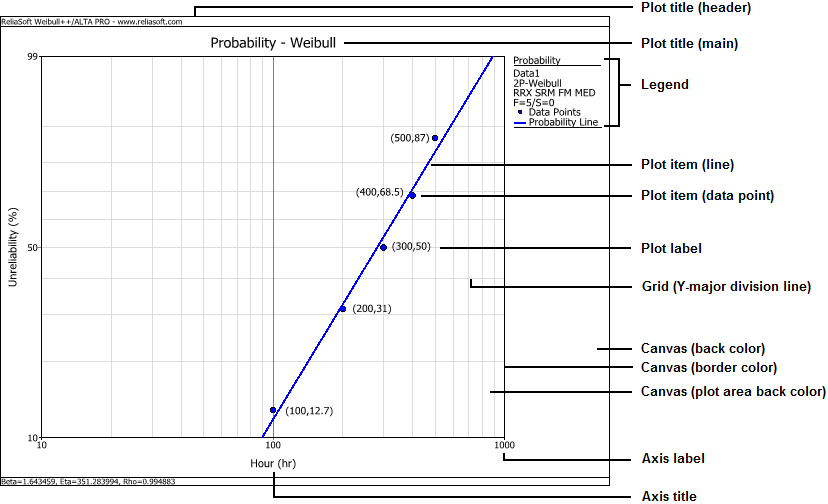
As an example, the following picture identifies some of the basic plot elements that can be configured via the Plot Setup.
