Multiple Linear Regression Folio Analysis Results
When accessed from a multiple linear regression folio, the Analysis Summary window will contain detailed information about analysis results, including information that describes how each predictor affects response that is currently selected on the control panel.
If the current response data has been analyzed, you can open the window by clicking the View Analysis Summary icon on the control panel.
![]()
If the current response data has not been analyzed, the icon will still be available so you can view the folio's analysis history.
Select an item in the Available Report Items panel to display it on the spreadsheet. Each item is described next.
Analysis Results
The Analysis of Variance (ANOVA) table provides general information about the effects of the predictors on the selected response. This information may be presented for individual predictors and or for all the predictors treated as a single group, depending on your analysis setting on the control panel.

 ANOVA
Table Columns
ANOVA
Table ColumnsThe Regression table provides specific information on the contribution of predictor to the variation in the response and an analysis of the significance of this contribution.
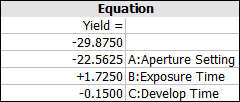
The Regression Equation information is presented using multiple tables.
Additional Results
All of the following tables provide information that was generated from the main calculations. The available tables will vary depending on the design type you are working with. The results that could be available include: