Interval Width Estimator
The usage format of the warranty analysis folio converts the amount of usage accumulated by a fielded product into failures/suspensions data so you can perform life data analysis and/or forecast future warranty returns. When you use a statistical distribution to take into account the variations in the amount of product usage, the conversion process becomes more involved. In order to convert the usage data to failures/suspensions data, the software must have a way to estimate the amount of usage accumulated by units still operating in the field at the end of the observation period (i.e., suspensions).
The software uses the concept of interval width to estimate the amount of usage accumulated by the suspensions. The interval width is a value that is used to divide the usage distribution into usage rate intervals. For example, if the usage distribution represents the number of pages printed per year, and you specify 500 for the interval width, the software will break the distribution into usage rate intervals of 0 to 500 pages per year, 501 to 1000 pages per year, 1001 to 1500 pages per year, and so on. The software uses the intervals to obtain from the distribution the percentage of customers who use the product at each of the usage rates. The percentages are then used to obtain the probability that any given suspended unit will have accumulated usage at the rate represented by those intervals.
The Interval Width Estimator is a tool that helps you to determine an appropriate interval width by providing a pdf graph of the usage distribution and showing you how well the usage values assigned to the suspended units track the pdf. Note that this tool only serves as a guide and that the appropriate interval width value will depend upon your own knowledge of typical product usage levels.
Estimating the Interval Width
To use the Interval Width Estimator, you must first define the usage distribution on the Suspensions page of the control panel. Next, open the tool by clicking the icon in the Interval Width area on the Suspensions page (note that this area will be displayed only when the warranty analysis folio has been configured for the usage format and only if you have selected to define the usage with a distribution).
The interval width is estimated based on the following inputs:
In the End Usage field, enter the length of the observation period. This sets the maximum value for the x-axis.
In the Number of Intervals field, set the maximum number of intervals you want to divide the usage distribution into.
In the Number of Suspensions field, set the total number of suspensions that are expected to continue operating in the field at the end of the observation period.
Click the Calculate icon to estimate the interval width.
![]()
The resulting rate intervals will be plotted in a bar chart and superimposed over the pdf of the usage distribution. To show the estimated number of suspensions that accumulate usage at each rate represented by each interval, move the pointer over the bars depicting the intervals.
You can adjust the number of intervals and perform the calculation again to obtain an interval width value that provides a good number of intervals for the usage distribution. The following plots show some examples of how different interval widths may fit the same usage distribution.
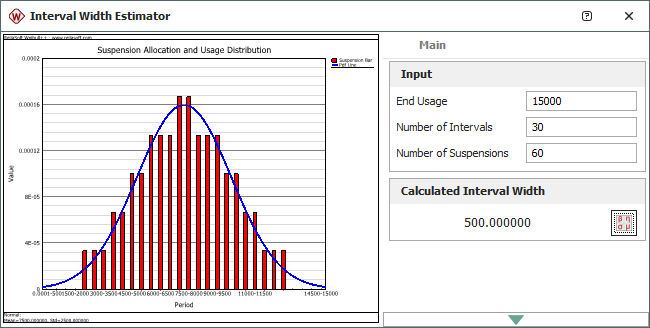
Figure 1 shows a plot with a narrow interval width, resulting in a pdf that is divided into several small segments. This causes the allocated suspensions to track the pdf poorly. When the warranty data are converted to failures/suspension data, there may be insufficient accuracy of the usage values of the suspensions (i.e., several intervals with few suspended units in each interval).

Figure 1: Interval width = 500.
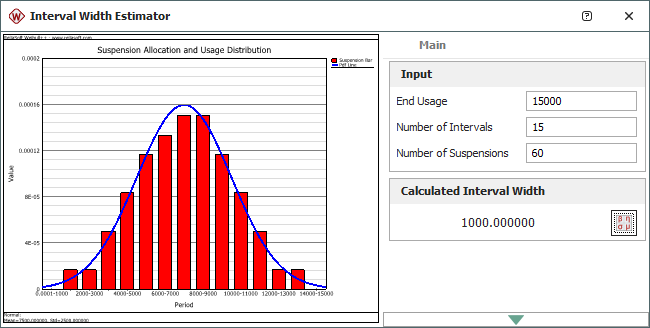
Figure 2 shows a plot with a wider interval width, resulting in a pdf that is divided into larger segments. The allocated suspensions track the usage pdf well. Therefore, this interval width would be appropriate for the data set.

Figure 2: Interval width = 1,000.
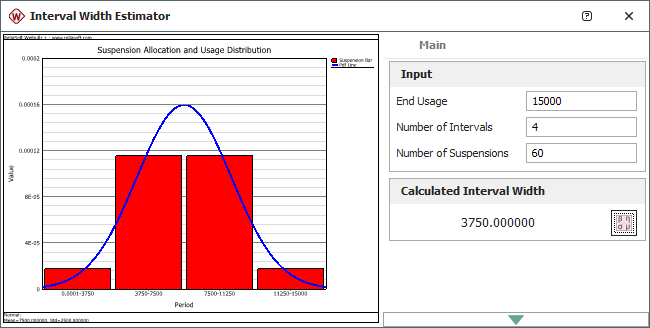
Figure 3 shows a plot with a very wide interval width. Again, this causes the allocated suspensions to track the pdf poorly. When the warranty data are converted to failures/suspension data, there may be insufficient granularity of the suspensions (i.e., few intervals with a high number of suspended units in each interval).

Figure 3: Interval width = 3,750.