Growth Planning Folio Plots
For reliability growth data analysis only.
The Plot sheet in the growth planning folio shows a variety of plots that display the results that are expected if you implement the plan. To view the growth planning folio plots, choose Test and Planning > Analysis > Plot or click the icon on the control panel.
![]()
The following is a description of the different types of plots you can create for growth planning. For general information on working with plots, see Plot Utilities.
Plot Types
The following plots show the expected value of the specified metric across all planned test phases:
MTBF vs. Time (available only for the continuous growth planning folio)
Reliability vs. Time (available only for the discrete growth planning folio)
MTrBF vs. Time (available only for the discrete growth planning folio)
Failure Intensity vs. Time
For the plots above, you can use the check boxes in the control panel to select which of the following elements will be displayed in the plot:
For the Crow Extended model, the options are:
Nominal Idealized and Actual Idealized lines (also called idealized growth curves) show the overall characteristic pattern for the reliability growth across all phases of testing. The nominal curve is the best case scenario, which assumes that the average fix delay is zero. The actual curve takes into account the average fix delay. If fixes are not incorporated instantaneously, the actual line will show slower growth compared to the nominal line.
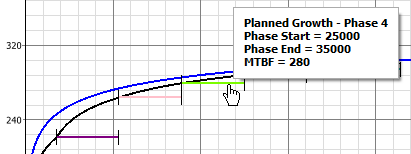
Planned Growth lines display information for each phase of testing (and thus are available only when you have provided information for each phase). These horizontal lines mark the time when each phase will begin and end, while the vertical position of each line shows the expected value of the metric at the beginning of the phase. You can point to the line to see the specific values. (Note that in the continuous growth planning folio, you can show confidence bounds on the planned growth lines, but only when you have at least 3 test phases specified on the folio's data sheet.)
The Termination Line shows the end time of the final test phase.
The Goal line shows the target value that you hope to achieve by the last phase of testing.
For the MIL-HDBK 189 model, the options are:
The Idealized Growth Curve line shows the overall characteristic pattern for the reliability growth across all phases of testing.
If the test phase settings are specified, the Average per Test Phase line shows either the average MTBF for each test phase on the MTBF vs. Time plot or the average failure rate for each test phase on the Failure Intensity vs, Time plot.
For the Crow Extended model, the following plots are also available:
Cumulative Number of B Modes shows the cumulative number of observed unique B failure modes versus time. These are failure modes that have been discovered and will be fixed.
MTBF B Unseen shows the mean time between failures due to B failure modes that have not yet appeared in testing. These are failure modes that are anticipated based on the analysis and will be fixed when/if they are discovered.
Discovery Rate shows the rate at which unique B failure modes are being discovered. In other words, it is the failure intensity of the unseen B failure modes.