Fractional Failure Analysis
You can use fractional failure analysis in Weibull++ life data folios to account for the effectiveness of an assumed corrective action or product redesign in your analyses. For example, if the fix for a failure is expected to be 70% effective, you can enter the failure count as 0.3 (30%) in the data sheet. This allows you to analyze a product's reliability, B10 life or other metrics, assuming an implemented fix.
Example
The data set used in this example is available in the example database installed with the Weibull++ software (called "Weibull20_Examples.rsgz20"). To access this database file, choose File > Help, click Open Examples Folder, then browse for the file in the Weibull sub-folder.
The name of the project is "Standard - Fractional Failures."
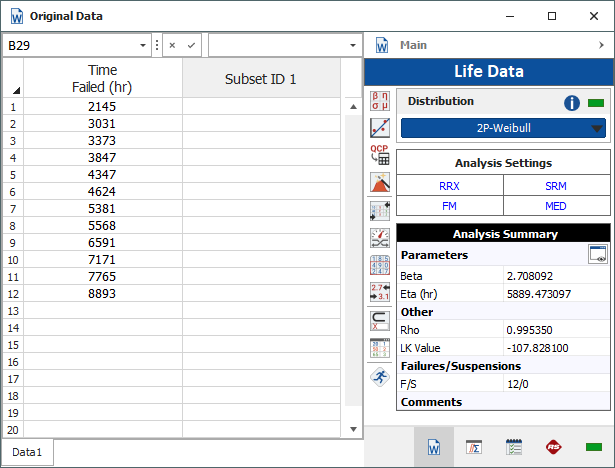
A product underwent a reliability test. The following picture shows the data set as it was entered in Weibull++.

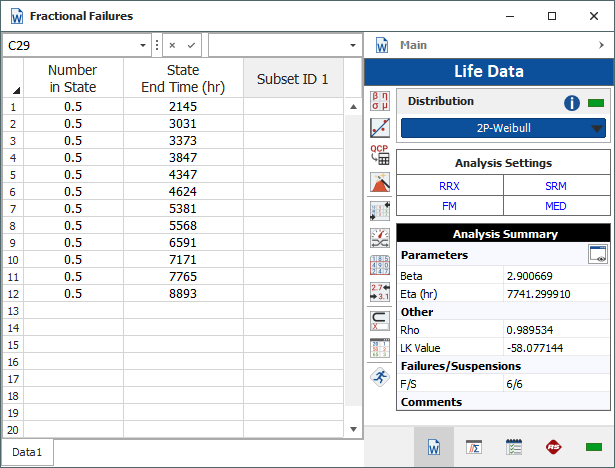
The analysts believe that the planned design improvements will yield 50% effectiveness. To estimate the reliability of the product based on the assumptions about the repair effectiveness, they enter the data in groups, counting a 0.5 failure for each group, as shown next.

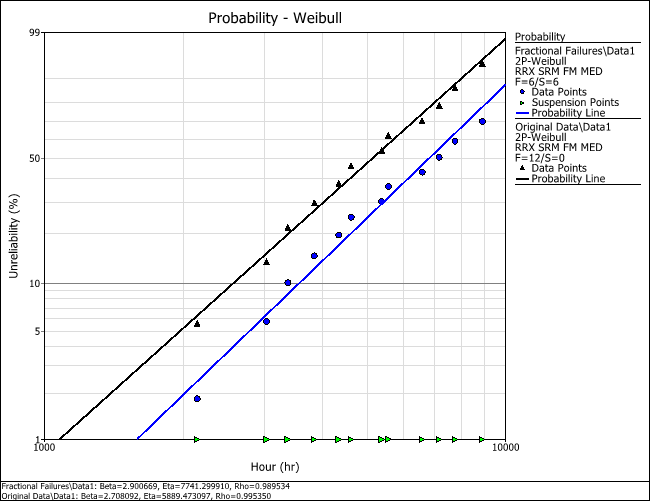
The overlay plot, shown next, compares the changes to the estimates in the parameters between the original data set and the data set that includes the repair effectiveness.
