Calculations with No Data Entered
Weibull++ gives you the flexibility to generate plots and calculate metrics for reliability models without entering the data that the reliability model is based upon. To do this, create a life data folio data sheet or a growth data folio sheet and, without entering any data, choose a distribution and click the Calculate icon on the Main page of the control panel.
![]()
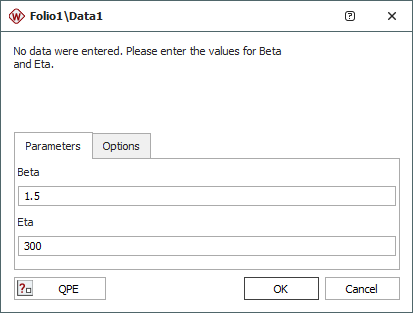
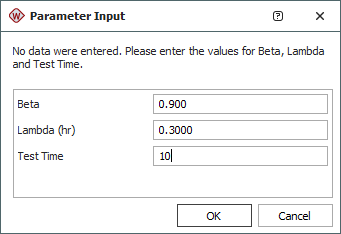
With no data specified, this opens an input window that allows you to enter the parameters for a model. After you enter the parameters and click OK, the parameters of the specified model will be displayed in the Analysis Summary area of the control panel. Any plots or QCP results you produce from this data sheet will be based on this model.

Options for a life data folio

Options for a reliability growth data folio
Tip: If you don't know the model parameters, you have the option to use the Quick Parameter Estimator (QPE) to estimate them based on what you know about the behavior over time.
Generating a Data Set Based on the Specified Reliability Model
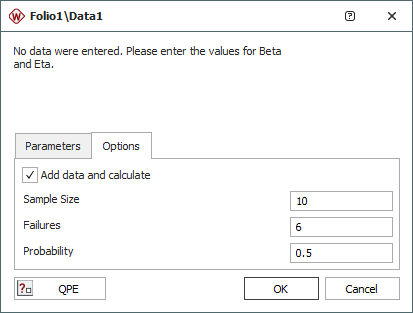
For life data folios, you can generate a data set based on a specified model. To do this, click the Options tab in the input window and then select the Add data and calculate check box, as shown next.

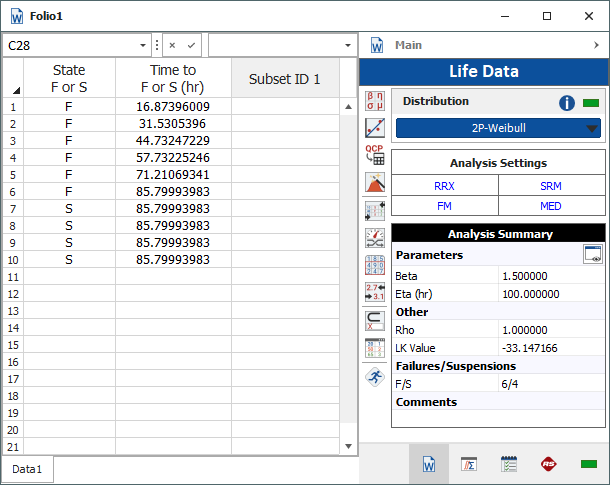
With this setting enabled, Weibull++ will generate a data set that is based on the specified model and your desired sample size, number of failures and probability. The probability value is the chance that the ith failure will occur after the generated failure time Ti. For example, the following picture shows the generated failure times for a 2-parameter Weibull distribution using the following settings:
Beta = 1.5
Eta = 100
Sample size = 10
Number of failures = 6
Probability = 50%

In this case, the 1st failure time (T1) is estimated to be about 16.874 hours. This means that when you conduct a test on a product using the same sample size and reliability model, there is a 50% chance that the 1st failure will occur after 16.874 hours. Therefore, 16.874 can also be thought of as the one-sided lower bounds for the 1st failure time at a confidence level of 50%. The rest of the failure times in the data set can be read in a similar manner.