Beta Bounds Window
For reliability growth data analysis only.
When you're viewing the Beta Bounds plot, you can specify which confidence levels to show by choosing Plot > Options > Plot Beta Bounds or by right-clicking plot and choosing the option from the shortcut menu. Beta Bounds is available when only A/BD modes are included in the data set analyzed with the Crow Extended model.
![]()
In the window that appears, you can select to show up to five confidence levels.
For each beta bound line you have selected to show, enter the confidence level as a percentage in the input field.
You can click the color field to define the line color for the beta bound. To add a new color to the Custom tab, right-click one of the color boxes in the bottom two rows.
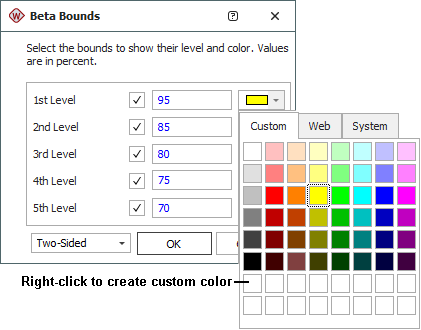
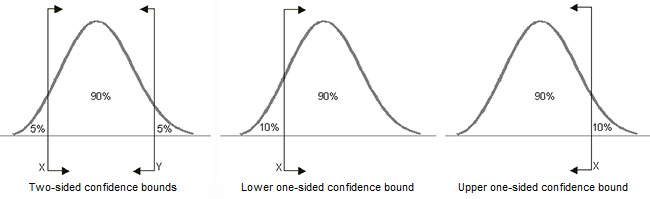
The drop-down list in the lower left corner of the window allows you to select which type of confidence bounds (one-sided or two-sided) to display in the plot. For example, if you use 90% one-sided bounds, then the upper and lower one-sided 90% bounds will be used (which is the same as using two-sided 80% bounds). The following graphics illustrate the difference between one- and two-sided bounds.