ALTA Test Plan Results Sheet
For life-stress data only.
The Test Plan Results sheet displays a summary of your inputs, the utility's recommended test plan and the time at which unreliability equals the value you entered in the BX% Life Estimate Sought field (i.e., Tp). If you entered a number of available test units, it also displays the standard deviation of Tp.
The results sheet is divided into two areas:
The Test Plan Inputs area displays a summary of all the inputs that were used to generate the test plan. This includes information for each specified stress type and probabilities of failure at various stress levels.
The Recommended Test Plan area displays the recommended stress levels to be used in the test and the recommended allocation of units to each stress level. Each row describes a stress level (which, for two-stress tests, will be a combination of stress values) and the number of units to be tested at that stress level. For example, consider the following plan.
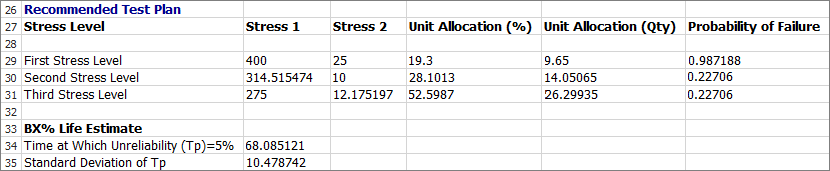
The row labeled "First Stress Level" recommends that 19.3% of the available units be tested at a level of 400 for Stress 1 and 25 for Stress 2. The Unit Allocation (Qty) column is visible when the Show Allocations as Qty option was chosen from the Unit Allocation drop-down list on the Test Plan Inputs sheet. In this example, it shows that 19.3% of the number of available units is 9.65.
Time at Which Unreliability (Tp) = 5% is the time at which unreliability equals the value you entered for BX Life Estimate Sought. This value is calculated based on the life distribution and probabilities of failure you entered in the Inputs sheet.
Standard Deviation of Tp is calculated only if you choose Show Allocations as Qty on the Test Plan Inputs sheet. The smaller the standard deviation of Tp, the less variation in Tp you can expect in repeated samplings. Thus, smaller values indicate a more robust test plan.